
Shuangxiang Zhao, Qingwen Liu, Yuanyuan Liu, Huilian Ma, Zuyuan He, "Navigation-grade resonant fiber-optic gyroscope using ultra-simple white-light multibeam interferometry," Photonics Res. 10, 542 (2022)
- Photonics Research
- Vol. 10, Issue 2, 542 (2022)
Abstract
1. INTRODUCTION
The fiber-optic gyroscope (FOG) utilizes the Sagnac effect between the two counterpropagating light beams for rotation measurement. As the core device in inertial navigation systems, FOG is indispensably adopted under many extreme environments like aerospace, drones, and wellbore surveys [1,2]. Those applications have a strong demand for the reliability and miniaturization of the gyroscope. The interferometric FOG (IFOG) is the first generation and the only mature type of FOG, in which the Sagnac effect behaves as the phase shift between the two counterpropagating light beams, and the phase shift is detected by the interference of a low-coherence light. The IFOG has a very simple structure known as a “minimal scheme” [3,4], which brings superiority in cost, system simplicity, robustness, and portability over the ring laser gyroscope [5,6] and the advantage of much higher resolution over the microelectromechanical system gyroscope [7,8].
In spite of their great success, high-resolution IFOGs usually employ kilometer-level fiber coil to enlarge the phase shift caused by rotation. The long fiber coil, however, intensifies the thermal ununiformity and leads to the Shupe effect, which would degrade the resolution [9]. By redirecting the light beam into the fiber coil, re-entrant FOG has been proposed as a size-reduced IFOG configuration to relieve the Shupe effect [10,11]. However, the re-entrant FOG is not a very effective option because its actual performance is limited by the optical power loss and the complicated demodulation method. The miniaturization of IFOG remains very challenging.
As the second generation of FOG, the resonant FOG (RFOG) is another potential solution to miniaturization, which employs a high-finesse recirculating fiber ring resonator (FRR) to enhance the Sagnac effect [12,13]. It has the same theoretical resolution as IFOG but with much shorter fiber length, and the nonreciprocity noises such as the Shupe effect can be effectively suppressed with a shorter fiber [2,14] in practice. More attractively, the technology for RFOG is also the most feasible solution to the on-chip gyroscope, in which an optical waveguide resonator replaces the FRR [15–18].
Sign up for Photonics Research TOC. Get the latest issue of Photonics Research delivered right to you!Sign up now
Active research has been dedicated to RFOG [19,20] over the past four decades, but progress has gone very slowly, and the best-reported RFOG has not reached the navigation grade yet [21,22]. Unlike the situation in IFOG, the Sagnac effect in RFOG behaves as the resonant frequency shift of FRR, so, up to date, all the RFOGs use narrow-linewidth lasers to detect the resonant frequency deviation, which introduces serious parasitic noises including backscattering, backreflection, polarization cross talk, nonlinear Kerr effect, and laser frequency noise [13]. In addition, at least two independent optical frequency locking loops are required to lock the laser to FRR resonances in both clockwise (CW) and counterclockwise (CCW) directions [23]. The extra elements for frequency locking further deteriorate the parasitic noises. In general, the current RFOG technologies lose the simplicity of IFOG, and the complicated system setup results in extra noises and fragility.
Here we have developed a new RFOG readout technique, in which the multibeam interferometry of the low-coherence white-light source is proposed to detect the resonant frequency deviation caused by Sagnac effect. It inherits the simplicity of IFOG with the same “minimal scheme,” and the two main problems of traditional RFOGs are avoided. A navigation-grade bias instability (BI) of 0.009°/h and an angle random walk (ARW) of 0.0093°/
2. GYRO PRINCIPLE
A. White-Light Multibeam Interferometry
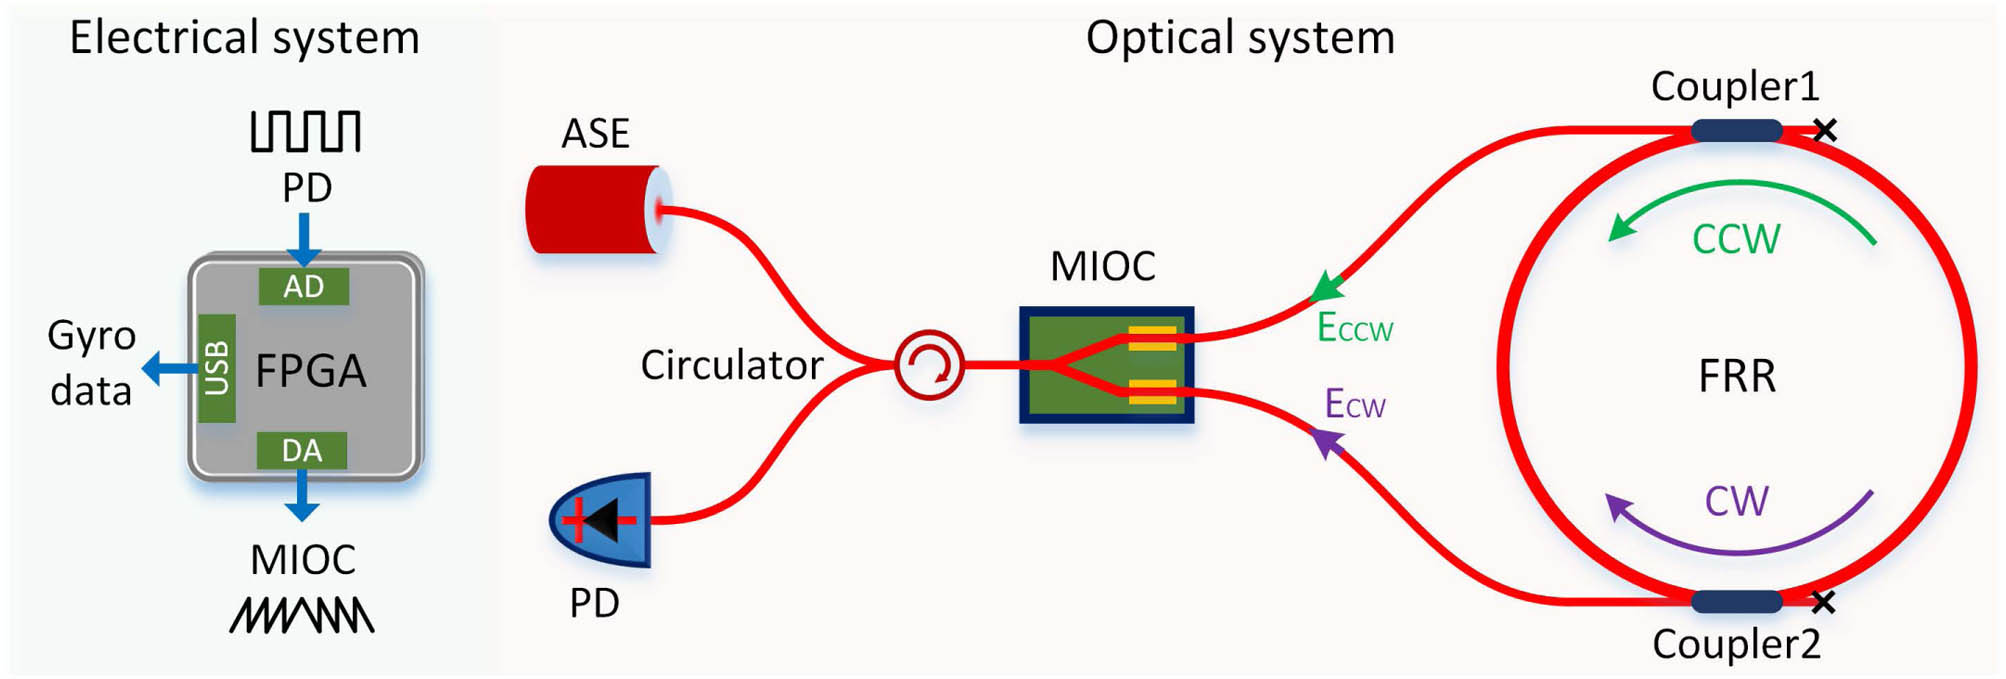
Figure 1.RFOG setup. ASE, amplified spontaneous emission; PD, photodetector; FPGA, field programmable gate array; MIOC, multifunction integrated-optics chip; FRR, fiber ring resonator; CW, clockwise; CCW, counterclockwise; AD, analog-to-digital; DA, digital-to-analog. Different from traditional IFOGs based on the minimal scheme, the long fiber coil is replaced with a high-finesse FRR. A photograph of the RFOG setup is also provided in Fig.
For two counterpropagating single-frequency laser beams (
B. Simulation and Experiment Demonstration
In the simulation, the spectral profile
![]()
Figure 2.(a) Simulation analysis and (b) experimental demonstration of Eq. (
Afterwards, an experiment is carried out to demonstrate the proposed white-light multibeam interferometry. In the experiment, the FRR in Fig. 1 is composed of two 98:2 couplers and a fiber coil. The fiber length and diameter of the coil are
A multifunction integrated-optics chip (MIOC) is adopted here for light splitting and combining, polarization filtering, and phase modulation. The MIOC is based on
By driving the MIOC with opposite sawtooth waveforms at its two arms, an equivalent
According to the results in Figs. 2(a) and 2(b), the PD receives maximal power
C. RFOG Modulation and Demodulation
The RFOG readout is based on utilizing the property of the response curve in Fig. 2(b). Because of the symmetry of the response curve, modulation techniques are necessary to discriminate between the positive/negative
![]()
Figure 3.Modulation signals and the corresponding
In the modulation, the
In the gyro uses, rotation-induced
A field programmable gate array (FPGA, NI 7855R) module with integrated analog-to-digital (AD) and digital-to-analog (DA) converters is adopted for
![]()
Figure 4.(a) Demodulation process in the FPGA; (b) measured error signal versus
3. GYRO TEST
The proposed RFOG is first adopted for the rotation test with the high-resolution rotating platform (TD-320), whose nominal rotation resolution and range are 0.0001°/s and >500°/s, respectively. A sinusoidal rotation rate (10°/h, 0.01 Hz) is applied to the RFOG. At the same time, the FPGA records the error signal and recovers the rotation. The rotation data are downsampled to 1 Sa/s via averaging and are plotted in Fig. 5(a), where the sine rotation rate is well recovered. Then the rotation rate is decreased to 1°/h, and Fig. 5(b) is obtained. The recovered sinusoidal curves prove that the resolution of the proposed RFOG is better than 1°/h in the bandwidth of 1 Hz.
![]()
Figure 5.Test results of the RFOG. Gyro readout under sinusoidal rotation of (a) 10°/h, (b) 1°/h, and (c) 0°/h; (d) moving average of the static test data in (c) with a time window of 1000 s; (e) spectral power density of the results in (a)–(c); (f) Allan deviation of the static test data in (c).
The RFOG is then horizontally placed in a sealed box for a static test, where the temperature fluctuation is about 0.4 K/h. In this case, the RFOG is only subjected to the Earth’s rotation, which is 7.8°/h at the testing site (Shanghai, China). The gyro data recorded in 35,000 s are shown in Fig. 5(c). The output has a bias around −4.5°/h, which may be attributed to the nonreciprocity of couplers [27]. When the RFOG is turned over to sense the opposite of the Earth’s rotation, the bias changes from −4.5°/h to −20.1°/h. The bias difference is twice the Earth’s rotation rate. As shown in Fig. 5(c), the dominating gyro noise has the white-noise characteristics. After averaging with a moving window of 1000 s, the long-term bias drift emerges, as shown in Fig. 5(d). Figure 5(e) plots the power spectral density of the gyro data in Figs. 5(a)–5(c). The peaks correspond to the applied rotation signals, and the noise floor is generally around 0.69°/(h · Hz0.5).
The overlapping Allan deviation of the 35,000-s gyro data is calculated and is shown in Fig. 5(f) [28]. An ARW of
Parameters of the RFOG
| Parameter | Value | Unit |
|---|---|---|
| BI | 0.009 | °/h |
| ARW | 0.0093 | °/h |
| Scale factor | 3.4 | °/(h · Hz) |
| Sampling rate | 20 | Sa/s |
| Measurement range | °/s | |
| Fiber length ( | m | |
| Diameter ( | 140 | mm |
| Finesse ( | 63 | – |
| Power at detector ( | μW |
4. NOISE ANALYSIS
A. Shot-Noise Limited Resolution
The resolution of RFOG is ultimately limited by the shot noise at the detector, which is given by [16,30]
B. RIN-Induced ARW Noise
The noises of gyros are typically classified into two types: short-term ARW noise and long-term nonreciprocity-induced bias drift. In Fig. 5(f), the turning point of Allan deviation appears at an averaging time of
In the excess RIN analysis, modulation on the MIOC is turned off, and
![]()
Figure 6.RIN of
On the other hand, the spectral shaping effect also has positive utilization to suppress the ARW noise [33,34]. By inserting another fiber resonator after the ASE source to reshape the spectra of
C. Nonreciprocity Noises
Other than ARW noise, nonreciprocity-induced long-term bias drift is another important factor of BI. These nonreciprocities originate from unwanted backreflection, backscattering, polarization cross talk, the Kerr effect, the Shupe effect, etc. [13]. These nonreciprocity noises significantly degrade the performance of traditional RFOG systems because of the employment of high-coherence lasers. However, they are well mitigated in this paper by the use of low-coherence light source and the minimal scheme.
The polarization cross talk in the proposed RFOG is suppressed in the following actions: first, the adoption of PM fiber minimizes the polarization fluctuations while light circulates inside the FRR. In addition, the MIOC has integrated polarizers to ensure the polarization consistency between the input and output light. The high polarization extinction ratio of the PM fiber and the MIOC makes the whole system operate stably in single polarization. Further, thanks to the low-coherence nature of the broadband light, the residual interference noise between two orthogonal polarizations is well mitigated [38]. The efficiency of these polarization-suppression actions (polarizer, PM fiber, and low-coherence source) has been widely demonstrated in numerous navigation-grade IFOGs.
The nonlinear Kerr effect is proportional to the intensity imbalance between the CW and CCW light waves. According to the analysis in Ref. [9], it can also be substantially weakened through the utilization of a low-coherence source.
The Shupe effect originates from thermal ununiformity along the long fiber coil. In most IFOG systems, the fiber coil is commonly fabricated with elaborate winding and packaging techniques to mitigate the thermal ununiformity [39,40]. The residual Shupe effect, however, limits the further resolution improvement of IFOG. Here, the equivalent length of the RFOG is quite long (
5. CONCLUSION
In summary, we present the first navigation-grade RFOG with the simplest readout scheme to date. As shown in Table 2, compared with traditional IFOGs and RFOGs, the proposed RFOG utilizes a low-coherence white-light source, high-finesse FRR, and the minimal scheme. It combines the key advantages of conventional IFOGs and RFOGs such as ultralow complexity and compact size. In the experiment, an ARW of 0.0093°
Comparison between the Proposed RFOG and Traditional FOGs
| Traditional IFOGs | Traditional RFOGs | Proposed RFOG | |
|---|---|---|---|
| Light source | White light | Laser | White light |
| Sensing element | Fiber coil | FRR | FRR |
| Resolution | High | Low | Medium |
| Size | Large | Small | Small |
| Complexity | Low | High | Low |
Acknowledgment
Acknowledgment. S. X. Zhao proposed the method, performed the experiment, and wrote the draft of the paper; Q. W. Liu, H. L. Ma, and Z. Y. He edited the paper and assisted in improving the sensor performance; S. X. Zhao and Y. Y. Liu analyzed the data; Z. Y. He supervised the project.
APPENDIX A
The MIOC integrates two phase modulators at the CW and CCW arms, respectively, and they are driven with opposite voltage to work in the push–pull mode. By applying sawtooth waveforms to the MIOC, the MIOC works as two frequency shifters, since frequency is the derivative of phase. Figure
![]()
Figure 7.Scheme of introducing equivalent Sagnac frequency via sawtooth modulation. (a) Modulation waveforms at two arms of the MIOC; (b) modulation process and scheme.
![]()
Figure 8.Photograph of the RFOG system. PC, personal computer.
The modulation process and scheme of the MIOC are shown in Fig.
For the same reason, the CCW light field (
Equations (
References
[1] E. J. Post. Sagnac effect. Rev. Mod. Phys., 39, 475-493(1967).
[2] H. C. Lefevre. The Fiber-Optic Gyroscope(2014).
[3] R. Luo, Y. Li, S. Deng, C. Peng, Z. Li. Effective suppression of residual coherent phase error in a dual-polarization fiber optic gyroscope. Opt. Lett., 43, 815-818(2018).
[4] X. S. Yao, H. Xuan, X. Chen, H. Zou, X. Liu, X. Zhao. Polarimetry fiber optic gyroscope. Opt. Express, 27, 19984-19995(2019).
[5] W. Chow, J. Gea-Banacloche, L. Pedrotti, V. Sanders, W. Schleich, M. Scully. The ring laser gyro. Rev. Mod. Phys., 57, 61-104(1985).
[6] Y.-H. Lai, M.-G. Suh, Y.-K. Lu, B. Shen, Q.-F. Yang, H. Wang, J. Li, S. H. Lee, K. Y. Yang, K. Vahala. Earth rotation measured by a chip-scale ring laser gyroscope. Nat. Photonics, 14, 345-349(2020).
[7] M. N. Armenise, C. Ciminelli, F. Dell’Olio, V. M. Passaro. Advances in Gyroscope Technologies(2010).
[8] K. Liu, W. Zhang, W. Chen, K. Li, F. Dai, F. Cui, X. Wu, G. Ma, Q. Xiao. The development of micro-gyroscope technology. J. Micromech. Microeng., 19, 113001(2009).
[9] I. A. Andronova, G. B. Malykin. Physical problems of fiber gyroscopy based on the Sagnac effect. Phys. Usp., 45, 793-817(2002).
[10] C.-Y. Liaw, Y. Zhou, Y.-L. Lam. Characterization of an open-loop interferometric fiber-optic gyroscope with the Sagnac coil closed by an erbium-doped fiber amplifier. J. Lightwave Technol., 16, 2385-2392(1998).
[11] Z. Hu, Y. Zhang, Z. Pan, Q. Tang. Digital closed-loop re-entrant fiber-optic rotation sensor with amplified Sagnac loop. IEEE Photon. Technol. Lett., 12, 1040-1042(2000).
[12] R. Carroll, C. Coccoli, D. Cardarelli, G. Coate. The passive resonator fiber optic gyro and comparison to the interferometer fiber gyro. Proc. SPIE, 719, 169-177(1987).
[13] H. Ma, J. Zhang, L. Wang, Z. Jin. Development and evaluation of optical passive resonant gyroscopes. J. Lightwave Technol., 35, 3546-3554(2016).
[14] D. M. Shupe. Thermally induced nonreciprocity in the fiber-optic interferometer. Appl. Opt., 19, 654-655(1980).
[15] K. Suzuki, K. Takiguchi, K. Hotate. Monolithically integrated resonator microoptic gyro on silica planar lightwave circuit. J. Lightwave Technol., 18, 66-72(2000).
[16] H. Ma, J. Zhang, L. Wang, Y. Lu, D. Ying, Z. Jin. Resonant micro-optic gyro using a short and high-finesse fiber ring resonator. Opt. Lett., 40, 5862-5865(2015).
[17] W. Liang, V. S. Ilchenko, A. A. Savchenkov, E. Dale, D. Eliyahu, A. B. Matsko, L. Maleki. Resonant microphotonic gyroscope. Optica, 4, 114-117(2017).
[18] P. P. Khial, A. D. White, A. Hajimiri. Nanophotonic optical gyroscope with reciprocal sensitivity enhancement. Nat. Photonics, 12, 671-675(2018).
[19] X. Wang, Z. He, K. Hotate. Reduction of polarization-fluctuation induced drift in resonator fiber optic gyro by a resonator with twin 90° polarization-axis rotated splices. Opt. Express, 18, 1677-1683(2010).
[20] H. Li, Y. Lin, L. Liu, H. Ma, Z. Jin. Signal processing improvement of passive resonant fiber optic gyroscope using a reciprocal modulation-demodulation technique. Opt. Express, 28, 18103-18111(2020).
[21] M. Smiciklas, G. Sanders, L. Strandjord, W. Williams, E. Benser, S. Ayotte, F. Costin. Development of a silicon photonics-based light source for compact resonator fiber optic gyroscopes. DGON Inertial Sensors and Systems, 1-12(2019).
[22] G. Sanders, L. Strandjord, J. Wu, W. Williams, M. Smiciklas, M. Salit, C. Narayanan, E. Benser, T. Qiu. Improvements of compact resonator fiber optic gyroscopes. DGON Inertial Sensors and Systems, 1-12(2017).
[23] H. Ma, J. Zhang, L. Wang, Z. Jin. Double closed-loop resonant micro optic gyro using hybrid digital phase modulation. Opt. Express, 23, 15088-15097(2015).
[24] J. E. Heebner, V. Wong, A. Schweinsberg, R. W. Boyd, D. J. Jackson. Optical transmission characteristics of fiber ring resonators. IEEE J. Quantum Electron., 40, 726-730(2004).
[25] G. B. Malykin. Sagnac effect in ring lasers and ring resonators: how does the refractive index of the optical medium influence the sensitivity to rotation?. Phys. Usp., 57, 714-720(2014).
[26] S. Zhao, Q. Liu, Z. He. White-light-driven resonant fiber-optic strain sensor. Opt. Lett., 45, 5217-5220(2020).
[27] Z. Wang, Y. Yang, P. Lu, R. Luo, Y. Li, D. Zhao, C. Peng, Z. Li. Dual-polarization interferometric fiber-optic gyroscope with an ultra-simple configuration. Opt. Lett., 39, 2463-2466(2014).
[28] W. J. Riley. Handbook of Frequency Stability Analysis(2008).
[29] J. Davis, S. Ezekiel. Closed-loop, low-noise fiber-optic rotation sensor. Opt. Lett., 6, 505-507(1981).
[30] R. Meyer, S. Ezekiel, D. W. Stowe, V. Tekippe. Passive fiber-optic ring resonator for rotation sensing. Opt. Lett., 8, 644-646(1983).
[31] W. Burns, R. Moeller, A. Dandridge. Excess noise in fiber gyroscope sources. IEEE Photon. Technol. Lett., 2, 606-608(1990).
[32] Y. Zheng, H. Xu, J. Song, L. Li, C. Zhang. Excess relative-intensity-noise reduction in a fiber optic gyroscope using a Faraday rotator mirror. J. Lightwave Technol., 38, 6939-6947(2020).
[33] J. Honthaas, J.-J. Bonnefois, E. Ducloux, H. Lefèvre. Interferometric filtering of the excess relative intensity noise of the broadband source of a fiber optic gyroscope. Proc. SPIE, 9157, 91572D(2014).
[34] H. Zhang, X. Chen, X. Shu, C. Liu. Fiber optic gyroscope noise reduction with fiber ring resonator. Appl. Opt., 57, 7391-7397(2018).
[35] A. Aleinik, I. Deineka, M. Smolovik, S. Neforosnyi, A. Rupasov. “Compensation of excess RIN in fiber-optic gyro. Gyrosc. Navigation, 7, 214-222(2016).
[36] Z. Wang, Y. Yang, Y. Li, X. Yu, Z. Zhang, Z. Li. Quadrature demodulation with synchronous difference for interferometric fiber-optic gyroscopes. Opt. Express, 20, 25421-25431(2012).
[37] S. X.-Y. Huang, N. Sarma, K. M. Killian, J. E. Goodwin. Optical signal noise reduction for fiber optic gyroscopses. U.S. patent(1999).
[38] W. Burns, R. Moeller. Polarizer requirements for fiber gyroscopes with high-birefringence fiber and broad-band sources. J. Lightwave Technol., 2, 430-435(1984).
[39] F. Mohr. Thermooptically induced bias drift in fiber optical Sagnac interferometers. J. Lightwave Technol., 14, 27-41(1996).
[40] Z. Li, Z. Meng, T. Liu, X. S. Yao. A novel method for determining and improving the quality of a quadrupolar fiber gyro coil under temperature variations. Opt. Express, 21, 2521-2530(2013).


Set citation alerts for the article
Please enter your email address

© Copyright 2018-2021 | Chinese Laser Press. All Rights Reserved 沪ICP备15018463号-20