
Haosong Yu, Yongning Zou, Zhibin Zhang, Gongjie Yao, Rifeng Zhou. Image Reconstruction of Incomplete CT Scanning Using a CAD Model[J]. Acta Optica Sinica, 2021, 41(6): 0611002
- Acta Optica Sinica
- Vol. 41, Issue 6, 0611002 (2021)
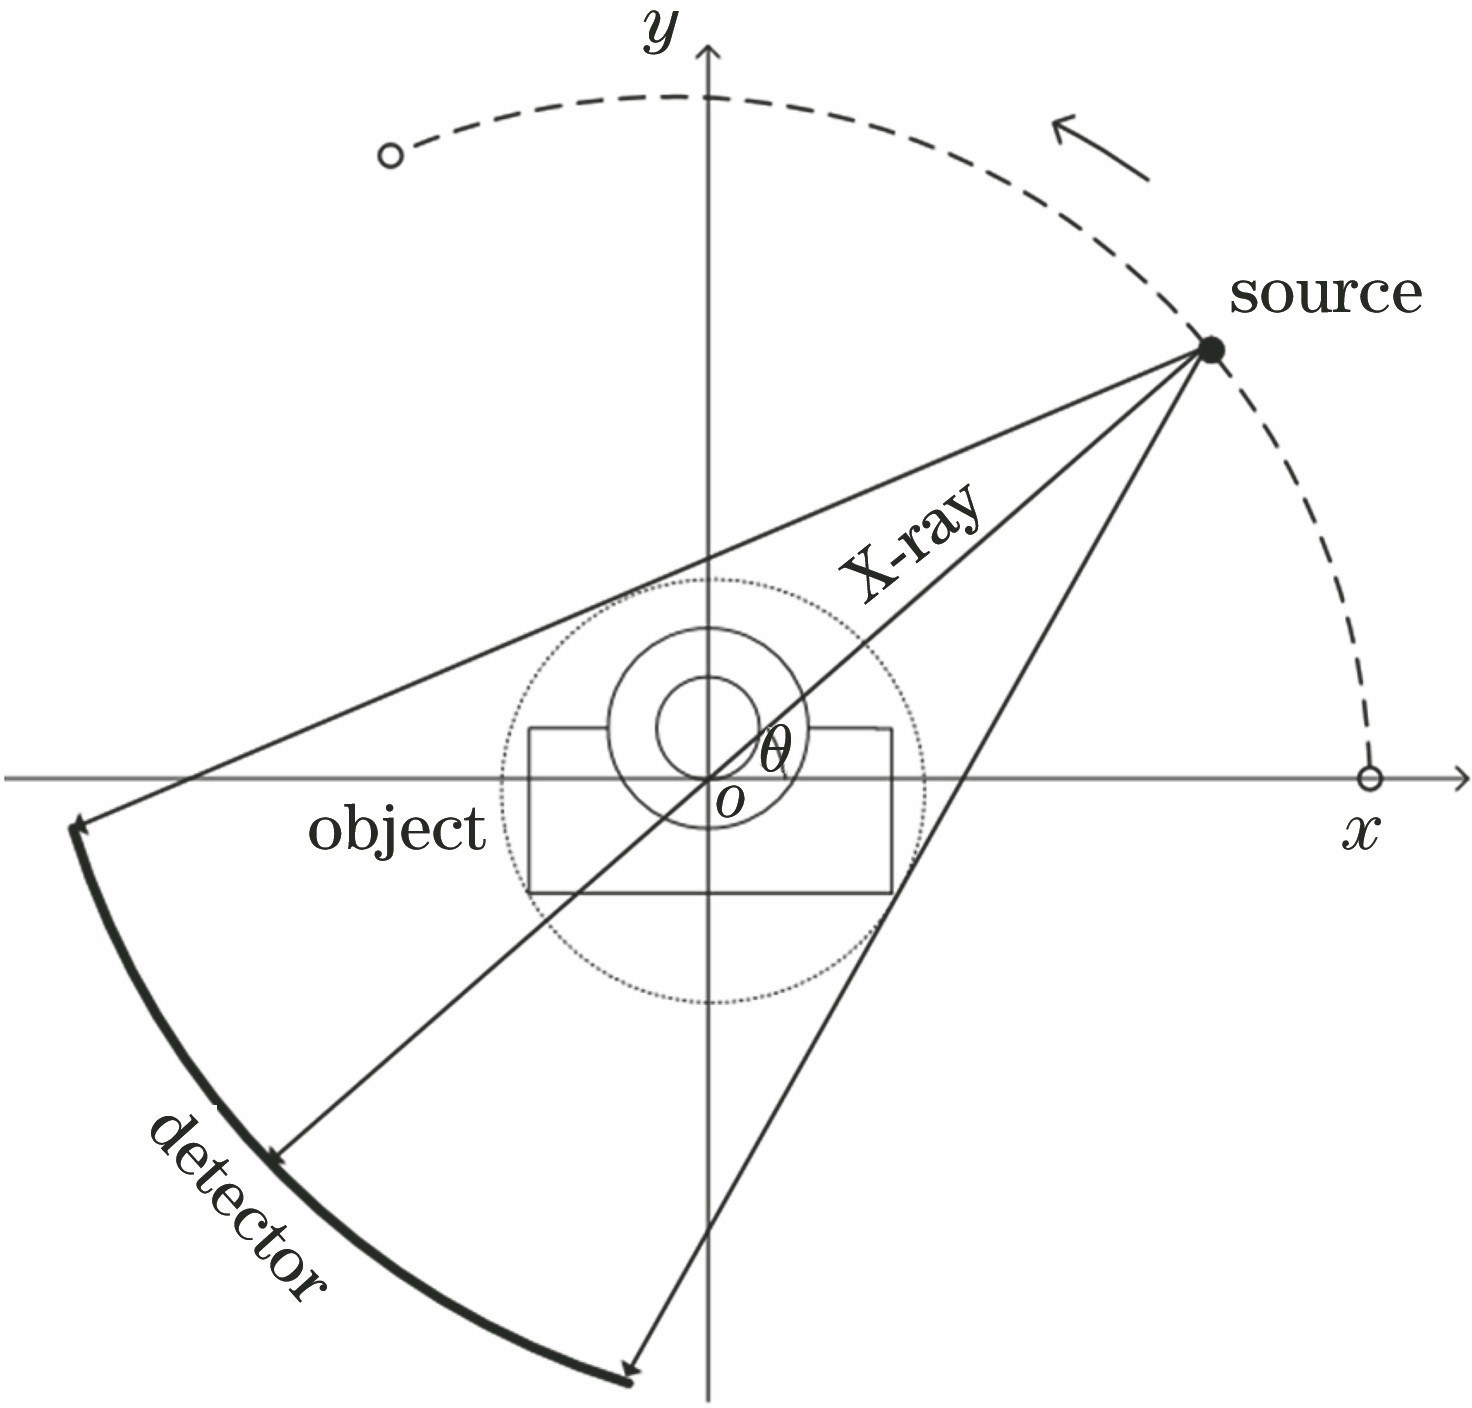
Fig. 1. Scanning diagram of limited angle CT
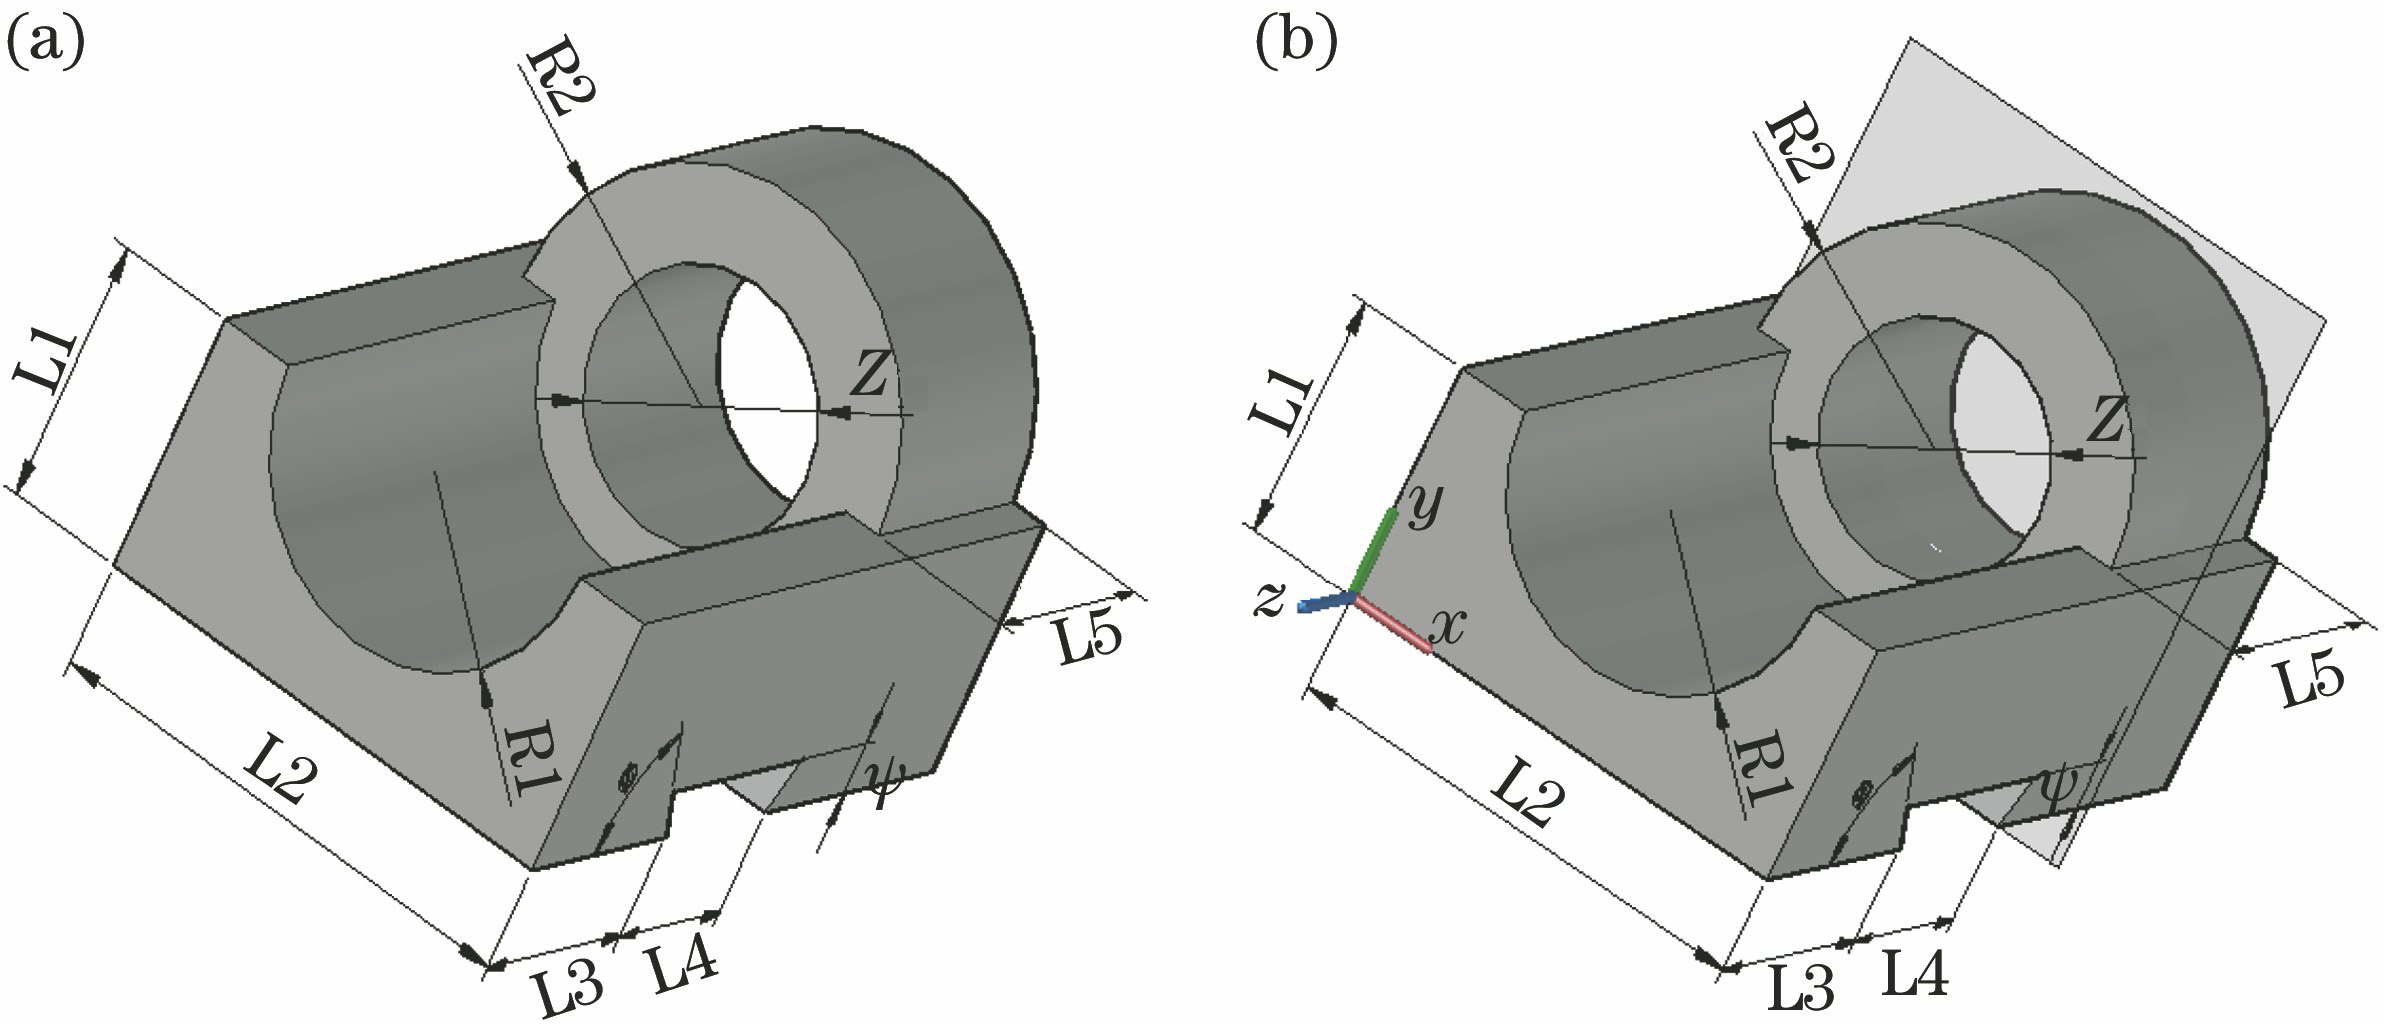
Fig. 2. CAD model of object and schematic of section. (a) CAD model; (b) section
Fig. 3. Image of acquisition process. (a) Pixel section; (b) attenuation coefficient image; (c) prior image
Fig. 4. Simulated images. (a) Include defects; (b) include defects and noise
Fig. 5. Projection data in the range of [1°,120°]
Fig. 6. Reconstructed images with different NTV. (a) 10; (b) 20; (c) 30; (d) 40
Fig. 7. PSNR and SSIM of images with different NTVreconstructed by SART+TVM+PRIOR algorithm
Fig. 8. Reconstructed images under different iterations. (a) 100; (b) 300; (c) 500
Fig. 9. PSNR and SSIM versus number of iterations. (a) PSNR; (b) SSIM
Fig. 10. 3D model made by AutoCAD software. (a) Model 1; (b) model 2
Fig. 11. Software and hardware of 3D printing and real object. (a) Software interface; (b) printer; (c) object
Fig. 12. Microfocus CT scanner
Fig. 13. Flowchart of acquiring prior image
Fig. 14. CT images reconstructed in the range of [1°,150°] and [1°,120°], display window is [0,1]. (a) SART; (b) SART+PRIOR; (c) SART+TVM; (d) SART+TVM+PRIOR
Fig. 15. CT images reconstructed in the range of [1°, 150°] and [1°, 120°], display window is [0, 1]. (a) SART; (b) SART+PRIOR; (c) SART+TVM; (d) SART+TVM+PRIOR
|
Table 1. Quantitative index of reconstructed images with different NTV
|
Table 2. Quantitative index of image a and b
|
Table 3. Parameters of the scanning

Set citation alerts for the article
Please enter your email address
© Copyright 2018-2021 | Chinese Laser Press. All Rights Reserved 沪ICP备15018463号-20