• Journal of Geographical Sciences
  • Vol. 30, Issue 12, 1963 (2020)
Zhiming FENG1、2, Chiwei XIAO1、2、*, Peng LI1、2, Zhen YOU1、2, Xu YIN1、2, and Fangyu ZHENG1、2
Author Affiliations
  • 1Institute of Geographic Sciences and Natural Resources Research, CAS, Beijing 100101, China
  • 2College of Resources and Environment, University of Chinese Academy of Sciences, Beijing 100049, China
  • show less
    DOI: 10.1007/s11442-020-1822-8 Cite this Article
    Zhiming FENG, Chiwei XIAO, Peng LI, Zhen YOU, Xu YIN, Fangyu ZHENG. Comparison of spatio-temporal transmission characteristics of COVID-19 and its mitigation strategies in China and the US[J]. Journal of Geographical Sciences, 2020, 30(12): 1963 Copy Citation Text show less
    Distributions of population (2018) and economic densities (2020) in China and the US
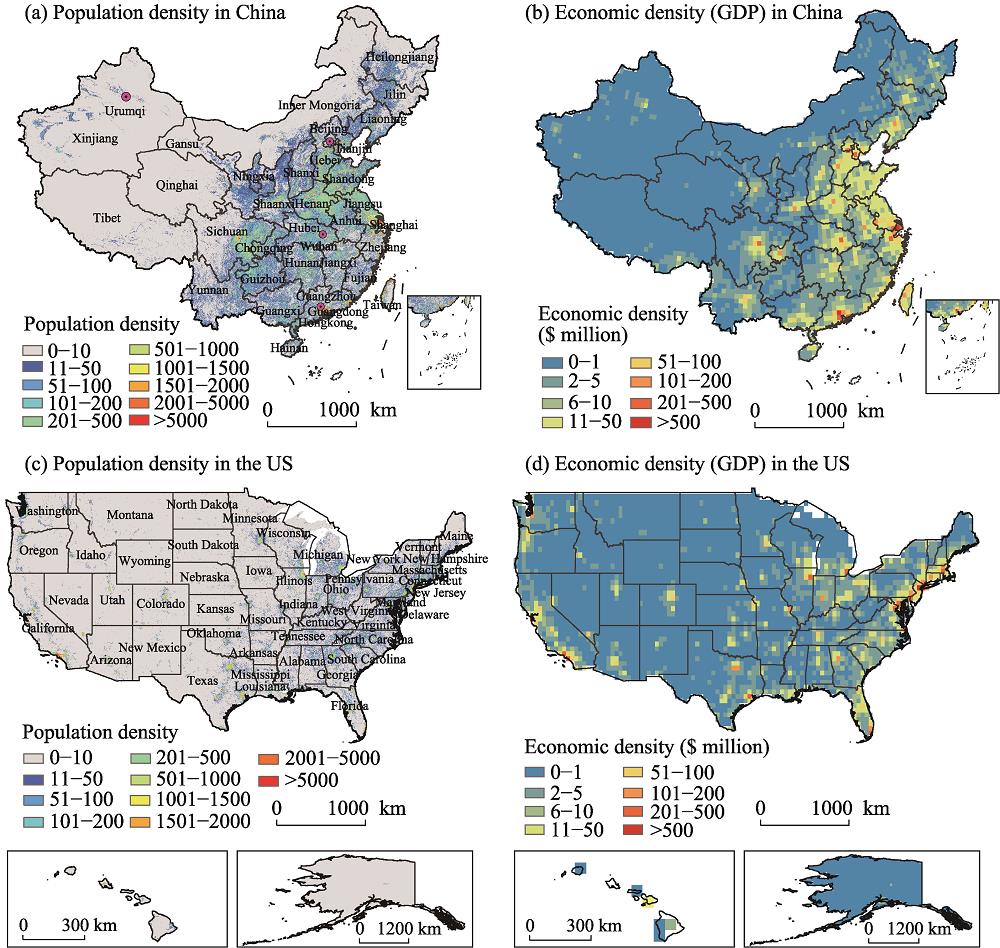
    Fig. 1. Distributions of population (2018) and economic densities (2020) in China and the US
    The five stages of COVID-19 outbreak
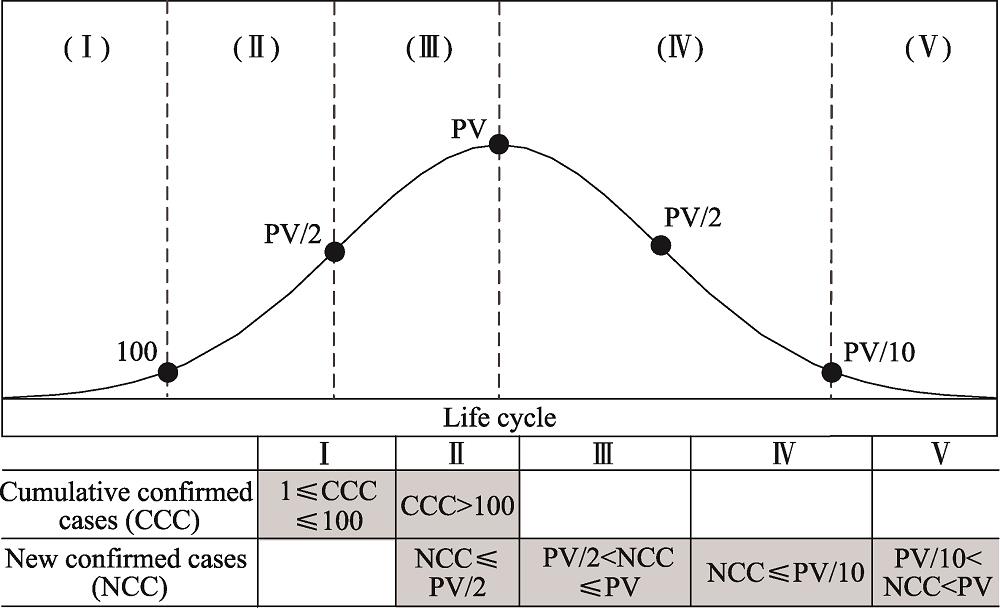
    Fig. 2. The five stages of COVID-19 outbreak
    Comparisons of the CCC of COVID-19 between China and the US
    Fig. 3. Comparisons of the CCC of COVID-19 between China and the US
    Comparisons of the NCC and CCC of COVID-19 over time between (a) China and (b) the US
    Fig. 4. Comparisons of the NCC and CCC of COVID-19 over time between (a) China and (b) the US
    Comparisons of the cumulative deaths of COVID-19 between China and the US
    Fig. 5. Comparisons of the cumulative deaths of COVID-19 between China and the US
    Spatio-temporal dynamics process of the CCC as well as NCC and CCC per 10,000 people of COVID-19 at critical time points in China and its provinces
    Fig. 6. Spatio-temporal dynamics process of the CCC as well as NCC and CCC per 10,000 people of COVID-19 at critical time points in China and its provinces
    Spatio-temporal dynamics process of the CCC as well as NCC and CCC per 10,000 people of COVID-19 at critical time points in the US and its states
    Fig. 7. Spatio-temporal dynamics process of the CCC as well as NCC and CCC per 10,000 people of COVID-19 at critical time points in the US and its states
    Correlations between the CCC and population, cumulative deaths and population, the CCC and GDP, cumulative deaths and GDP in China (excluding Hubei Province) and the US
    Fig. 8. Correlations between the CCC and population, cumulative deaths and population, the CCC and GDP, cumulative deaths and GDP in China (excluding Hubei Province) and the US
    Timelines of COVID-19 developments in China and the US
    Fig. 9. Timelines of COVID-19 developments in China and the US
    Chinathe US
    TimelineInterval daysCCCTimelineInterval daysCCC
    12019/12/8-112020/1/22-1
    102020/1/12527102020/2/31311
    1002020/1/18171211002020/3/32918
    10002020/1/257140910002020/3/1181285
    10,0002020/2/1711,90110,0002020/3/19813,748
    20,0002020/2/4423,718100,0002020/3/278101,962
    40,0002020/2/10642,372500,0002020/4/1115526,776
    60,0002020/2/14466,3761,000,0002020/4/28171,012,582
    80,0002020/3/21780,1772,000,0002020/6/10432,000,464
    Active cases2020/6/20-403Active cases2020/6/20-1,235,657
    Table 1.

    Dynamics of the COVID-19 CCC at critical time points in China and the US

    Zhiming FENG, Chiwei XIAO, Peng LI, Zhen YOU, Xu YIN, Fangyu ZHENG. Comparison of spatio-temporal transmission characteristics of COVID-19 and its mitigation strategies in China and the US[J]. Journal of Geographical Sciences, 2020, 30(12): 1963
    Download Citation