Abstract
Investigating the spatio-temporal transmission features and process of novel coronavirus disease 2019 (COVID-19) mitigation strategies are of great practical significance to understand the development of COVID-19 and establish international cooperation for prevention and control. In this paper, the cumulative number of confirmed cases, number of confirmed cases per day and cumulative number of deaths, were used to compare transmission paths, outbreaks timelines, and coping strategies of COVID-19 in China and the US. The results revealed that: first, the COVID-19 outbreaks in both China and the US exhibited a 6-week initiation stage. In China, the COVID-19 erupted in late January. It lasted only a short period of time and was almost completely contained within 6-8 weeks. But the COVID-19 erupted in early March in the US and was still in the peak or post-peak stage. Second, in China, the COVID-19 emerged in Wuhan and spread to other regions of Hubei Province and then nationwide, exhibiting a cross(“+”)-shaped of spread with Wuhan city as the center. Importantly, the COVID-19 in China had a large concentration and there were no national outbreaks. In contrast, the COVID-19 in the US first spread through New York and the western and eastern coasts but has since emerged throughout the entire country. Third, the lack of emergency response planning in both countries in the early stage (about 6-week) hampered COVID-19 prevention. However, actively high-pressure prevention and control measures were used to basically control COVID-19 in early March in China. And then China has gradually resumed business and production activities. Unfortunately, the US government missed the best opportunity to contain the epidemic. Faced with the choice between economic recovery and coronavirus containment, the US removed the quarantine and restriction measures too early. The COVID-19 is continuing to spread in the country and blossom everywhere, still showing no signs of receding.1 Introduction
The emergence of novel coronavirus disease 2019 (COVID-19) was declared by the World Health Organization (WHO) as a Public Health Emergency of International Concern on January 30, 2020 and a pandemic on March 11, 2020. On February 28, United Nations Secretary-General Guterres called “all governments to step up and do everything possible to contain the coronavirus” (XNA, 2020). As of October 10, COVID-19 has spread to more than 200 countries and territories, and more than 37.10 million confirmed cases have been reported, resulting in more than 1.07 million deaths (NHCPRC, 2020; WHO, 2020). After China won its domestic battle against the COVID-19 by implementing lockdowns, quarantines and other effective measures (Sun et al., 2020; Wang et al., 2020; Yang et al., 2020), the coronavirus continues to spread rapidly outside China with more than 0.2-0.3 million daily new cases. Among the affected countries, 179 have reported more than 1000 confirmed cases, 109 more than 10,000 cases, 42 more than 100,000 cases, and 4 (i.e., the US, India, Brazil, and Russia) more than one million cases. The COVID-19 is continuing pandemic in North America (e.g., the US and Canada), central-western Europe (e.g., Spain, France, the UK, Italy, and Germany), South America (e.g., Brazil, Colombia, Argentina, and Peru), China’s neighboring countries (e.g., India, Russia, Indonesia, and Pakistan), the Middle East (e.g., Iran, Iraq, Turkey, and Saudi Arabia), and Africa (e.g., South Africa and Egypt).
COVID-19 has received much attention from the international society and research communities since the beginning of the outbreak (Andersen et al., 2020; Franch-Pardo et al., 2020; Ippolito et al., 2020; Kupferschmidt et al., 2020; Sun et al., 2020; Tian et al., 2020). For example, the international medical journal The Lancet established special columns for continuous follow-up research on the outbreak and development of the COVID-19 pandemic (Alastair and Richard, 2020). This coronavirus is closely related to the UN 2030 Sustainable Development Goals (SDGs), especially Target 3.3 “By 2030, end the epidemics of AIDS, tuberculosis, malaria and neglected tropical diseases and combat hepatitis, water-borne diseases and other communicable diseases” under Goal 3 “Ensure healthy lives and promote well-being for all at all ages” (United Nations, 2016). The global pandemic COVID-19 has imposed huge challenges on human health, living, production, and socioeconomic development, and it has exerted severe impacts on social order and international relations (Ding et al., 2020a; Tian et al., 2020), causing extremely great uncertainties to the realization of these SDGs (Zhou et al., 2020). Other factors such as the accelerating global urbanization, high-frequency population flows, intensive economic and trade exchanges, and limited medical resources in developing countries have increased the difficulty in preventing and controlling the spread of COVID-19 (Shi et al., 2020; Sun et al., 2020; Zhou et al., 2020). Research currently focuses on medical and epidemiological aspects, such as the virus’s structure (Wrapp et al., 2020), pathological causes (Chen et al., 2020a), transmission path and transmissibility (Chen et al., 2020b), clinical manifestations (Huang et al., 2020a), treatments, as well as prevention and control (de Wit et al., 2020; Chen et al., 2020c; Lai et al., 2020). Few studies have investigated the geographical perspectives that impact the spatio-temporal transmission characteristics and process of COVID-19 (Gu et al., 2020; He et al., 2020; Liu et al., 2020). The spatio-temporal transmission of infectious diseases (such as COVID-19), including expansive- and migratory-transmission, is in effect a comprehensive geographical phenomenon that involves spatial and temporal virus circulation (Brooks et al., 2008). Under the global environmental changes, we have not fully understood the geographical characteristics of COVID-19 transmission (Wigginton et al., 2020), especially in the worst countries (e.g., the US) and countries where the first reported (e.g., China).
Scientific assessment of the spatio-temporal transmission characteristics, development dynamics and actual processes of COVID-19 as well as timely understanding of the infection seeding, major risk factors, and outbreak timelines has practical implications in facilitating international cooperation to monitor and control the pandemic (Li et al., 2020c). In this study, based on real-time pandemic data published by the Center for Systems Science and Engineering (CSSE 2019-nCoV), including the cumulative number of confirmed cases (CCC), infection rate (i.e., CCC per 10,000 people), and number of new confirmed cases per day (NCC) for measuring change in spread speed, cumulative number of deaths, mortality rate, and number of active cases, we used geographic information system (GIS) spatial analysis and mathematical-statistical method to compare the spatio-temporal transmission characteristics of COVID-19 in China and the US. Also, the reports on the pandemic published by Xinhua Net and USA Today were used to analyze the mitigation measures in both countries. We hope our research can deepen the understanding of coronavirus transmission characteristics and inform global decision-making on strategies to cope with the pandemic.
2 Materials and methods
2.1 Study areas
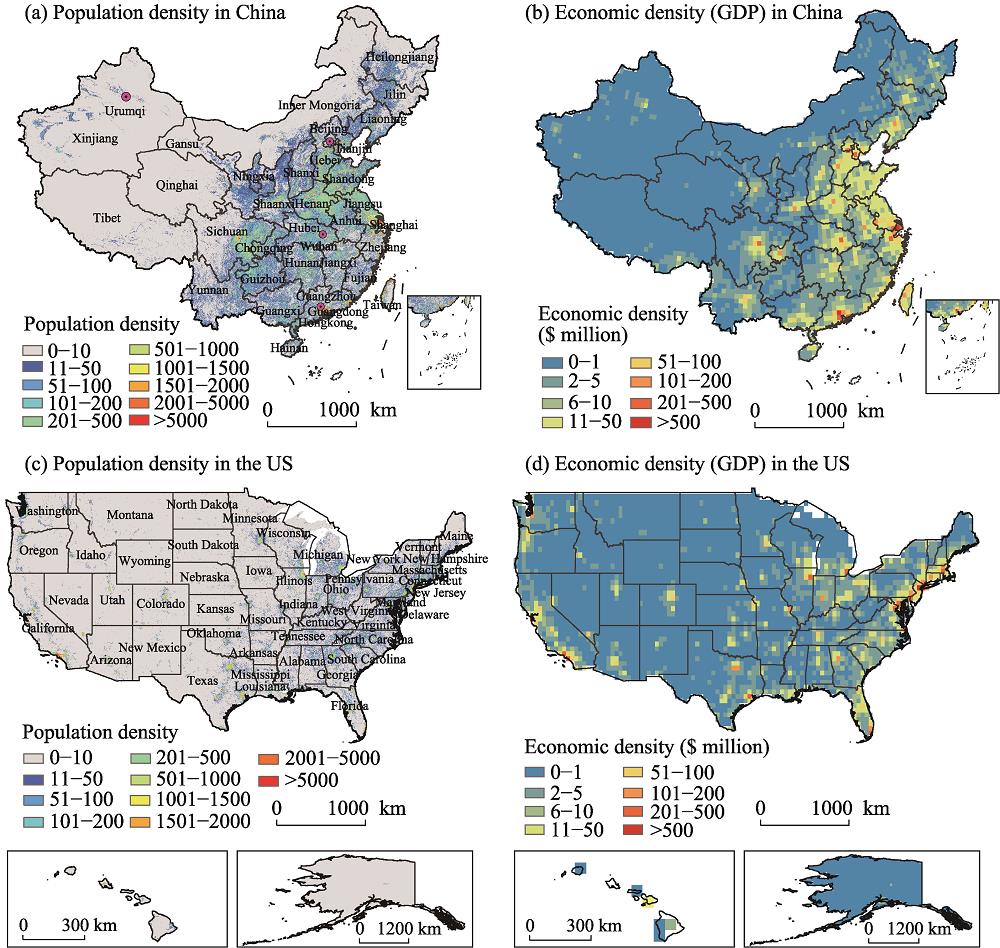
China is located in the eastern part of the Eurasia and west of the Pacific Ocean, with most of its territory in a latitudinal range of 20°N-50°N and having a temperate or subtropical climate (Figure 1). It is the world’s largest developing country, covering approximately 9.60 million km2. China has a population of 1.428 billion in 2018, an overall population density of 144/km2, and a density of above 400/km2 in eastern coastal areas. Since the reform and opening up in 1978, China’s medical service system has all-round improved, including stronger capacities for disease prevention and treatment. On December 8, 2019 (formally announced on January 11, 2020), viral pneumonia of unknown cause (i.e., COVID-19) was identified in Wuhan, followed by reports of cases in other regions (Zhu et al., 2020). From January 18 to early March 2020, the CCC reached 80,000 in China (including Hong Kong, Macau, and Taiwan). Since then, the situation has gradually stabilized. As of October 10, China had a CCC of 91,305 (0.64 infections per 10,000 people), resulting in 4746 deaths. The COVID-19 has basically been contained in China, with 406 active cases. These cases largely resulted from imported cases and local outbreaks (e.g., Qingdao).

Figure 1.
Distributions of population (2018) and economic densities (2020) in China and the USThe majority of the US territory is located between the Pacific and Atlantic Oceans in a latitudinal range of 30°N-50°N and has a temperate or subtropical climate (Figure 1). The US is the world’s largest developed country, covering approximately 9.37 million km2. The country had a population of 432 million in 2018 and an overall population density of 43/km2, with more densely populated eastern and western coastal areas. The US has a sophisticated healthcare system equipped with advanced medical technologies. However, the US is implementing major medical reforms to address the issue of the lack of socialized medicine (Li et al., 2018). The first confirmed case of COVID-19 in the US was reported on January 21, 2020 (Ghinai et al., 2020). The CCC in the US reached 100 on March 3, 2020, and has spread rapidly since then, with explosive growth in case count. As of October 10, the US (including Hawaii and Alaska) had a CCC of 7,717,932 (235.90 infections per 10,000 people), resulting in 214,370 deaths. The coronavirus is still raging through the US, which is now the “epicenter” of the global pandemic, with 50,000-60,000 new cases per day and more than 2.64 million active cases.
2.2 Data sources and treatments
The data used in the study involve the COVID-19, population grid information, and economic (i.e., gross domestic product (GDP)) data. Real-time global COVID-19 data published by the CSSE at Johns Hopkins University (https://github.com/CSSEGISandData/ COVID-19) (Dong et al., 2020) were used, including the CCC, NCC, cumulative number of deaths, and number of recovered patients. Here, the analyses were based on the reported cases in China from December 8, 2019 (first confirmed case) to June 20, 2020 and those in the US from January 22 (first confirmed case) to June 20, 2020. In particular, the major sources of the CSSE metadata include the WHO, the Chinese Center of Disease Control and Prevention (CDC), the US CDC, and the disease control and prevention authorities of other countries and territories. These datasets has been widely quoted by the Chinese Xinhua News Agency and other state media. Note that the data uses the Coordinated Universal Time, which is 8 hours behind China time. The time difference was therefore calibrated for the analysis of the COVID-19 outbreak in China.
2.3 Research framework and methods
The spatio-temporal transmission of COVID-19 was measured based on aforementioned the CCC or CCC per 10,000 people, the NCC or rate change of the NCC, cumulative number of deaths or mortality rate, and number of active cases. The dynamics and developments situation of COVID-19 in China and the US were compared from two perspectives, including transmission features and mitigation strategies. Among them, the NCC was used to assess the spatio-temporal transmission characteristics of COVID-19 in China and the US. The number of active cases is equal to the CCC minus the cumulative number of recovered patients minus the cumulative number of deaths. The CCC was used to measure the correlations between COVID-19 spread and population and economic densities. The timelines of COVID-19 outbreaks in both countries were analyzed in relation to the strategies taken to cope with the pandemic, including the coronavirus, governmental actions, and medical measures, with the aim of understanding the impacts of the strategies on COVID-19 spread.
The time series of the CCC and NCC were used to determine the COVID-19 outbreak timelines in China and the US, and then analyze the characteristics at different outbreak stages. A COVID-19 outbreak was divided into five stages, namely initiation (I), pre-peak (II), peak (III), post-peak (IV), and receding (V) (Figure 2). According to the evident differences of COVID-19 in both countries and Chinese characteristics, the rules of stage division were followed in this study: the initiation stage (I) is the time the first case to the time the CCC reaches 100. The pre-peak stage (II) is from the time the CCC reaches 100 to the time the NCC reaches approximately half of the peak value (PV) of the NCC. The peak stage (III) is from the time the NCC reaches approximately half of the PV of the NCC to the time it peaks. The post-peak stage (IV) is from the time the NCC peaks to the time the NCC reduces to 1/10 of the PV. This stage can be further divided into two sub-stages: (1) preliminary control: when the NCC decrease to half of the PV; and (2) effective control: when NCC decreases to 1/10 of the PV (i.e., receding stage). At this stage (V), the coronavirus is basically contained (Figure 2). Note that the PV was computed as the 7-day average of new cases.
Figure 2.
The five stages of COVID-19 outbreak3 Comparison of spatio-temporal features of COVID-19 in China and the US
3.1 Overall trends and characteristics
As of October 10, the global pandemic of COVID-19 continues to spread at accelerating speeds; the CCC had reached 37 million and resulting in more than one million deaths. As the COVID-19 battle evolved into a global crisis, there were considerable differences between the outbreaks in China and the US in terms of the CCC, CCC per 10,000 people, NCC (or change in the speed of spread), cumulative number of deaths, and mortality rate.
3.1.1 CCC and CCC per 10,000 people
The time series of the CCC and CCC per 10,000 people in China and the US (Figure 3) show that the initiation stage (I) lasted nearly 6 weeks for both countries. However, the CCC in China gradually stabilized within 6-8 weeks, and the outbreak has been basically contained since then. In contrast, over 20 weeks has elapsed since the initial outbreak in the US, but the CCC continues to increase with a long time to go before effective control is achieved. In particular, the CCC and CCC per 10,000 people of the US were over 80 and 350 times those of China, respectively.
Figure 3.
Comparisons of the CCC of COVID-19 between China and the USIn China, the first confirmed case was reported on December 8, 2019, and the CCC reached 100 on January 18, 2020, it means COVID-19 had started to break out. From late January to early February, the coronavirus started larger-scale spreading, and the CCC increased rapidly to reach 70,000 (Figure 3a). From mid-February to early March, the CCC reached 80,000 and then gradually stabilized. Overall, the outbreak of COVID-19 in China was basically contained within 6-8 weeks after initiation. In terms of the provincial level, the outbreak was predominated in Hubei Province, and the CCC accounted for over 80% of the national total. Note that the CCC of Wuhan city (50,000) accounted for approximately three-fourths of the provincial total. During the study period, the other major provinces in China in sequence were Guangdong (1.8%, 1634 cases), Henan (1.5%, 1276 cases), Zhejiang (1.5%, 1269), and Hong Kong (1.2%, 1128). In particular, the CCC per 10,000 people of Hubei was 11.5, more than 90 times that of other regions in China.
In the US, the first confirmed case was reported on January 21, 2020. The CCC stayed below 100 for a long period of 6 weeks (Figure 3b). The CCC reached 100 on March 3, marking the outbreak in the US. The CCC in the US has increased rapidly since then and exceeded that of China on March 26. From early March to mid-June, the CCC in the US explosively exponential increased by more than 10,000 times (y=1.2217e0.1394x, R2=0.929). As of October 10, the CCC had reached 7.71 million, ranking first among the world’s countries, and the CCC per 10,000 people had reached 236. The data show that the CCC in the US reached 100 within 6 weeks of identification of the first confirmed case, 1000 within one week, 80,000 within 8 days, 100,000 within 8 days, and increased another 20 times after only 5 days, indicating accelerating coronavirus spread. In other words, the CCC of the US was below 100 in February, exceeded 180,000 in March, reached one million in April, approached 1.8 million in May, and increased by more than 2.63 million in June. The outbreak in the US continued deteriorating, and the CCC had reached 7,717,932 on October 10, 2020, accounting for more than one-fifth of the global total. In terms of individual states, the top five states of California (852,410), Texas (815,915), Florida (728,921), New York (473,143), and Georgia (330,269) accounted for more than 40% of the national total CCC. During the study period, the CCC of each of the 32 states was above 1/100 of the national level. In addition, the CCC per 10,000 people of 44 states had reached 100. In particular, the CCC per 10,000 people of 33 states (including New York, New Jersey, Mississippi, and Massachusetts) was over 200.
3.1.2 NCC and change in the speed of spread
The COVID-19 outbreak in China and the US had markedly different temporal trajectories (including duration of spread and stages of spread) as shown by the time series of the NCC in both countries. Overall, the outbreak in China has evolved into the post-peak stage (IV) and it is largely contained (i.e., stage of the V) (Figure 4). In contrast, the US was in the peak (III) to post peak (IV) stage of the outbreak, without effective control (i.e., out-of-control).
Figure 4.
Comparisons of the NCC and CCC of COVID-19 over time between (a) China and (b) the USFrom the perspective of the NCC, the outbreak in China evolved through all five stages: Initiation (I), pre-peak (II), peak (III), post-peak (IV), and receding (V) during the first 28 weeks of the outbreak (2019/12/08-2020/06/20). In terms of the effectiveness of measures, the outbreak in China moved from preliminary control and effective control to the stage of almost completely containment (Figure 4a). The initiation stage (I) occurred before January 17 (the first 6 weeks), when the NCC stayed below 100. The pre-peak stage (II) lasted from January 18 to February 3 (weeks 7-8), when the number of infections rapidly increased, with hundreds and thousands of new cases reported per day. The peak stage (III) occurred in weeks 9-10 (from February 4 to 18), when the number of infections exploded by hundreds and thousands of new cases per day, with the NCC peaking at approximately 15,000 on February 13. Note that the data were calibrated to reflect the changes in the diagnostic criterion. Originally, a case was confirmed when the nucleic acid test (NAT) was positive. This single-test criterion was revised to one based on clinical diagnostics (fifth version of the criterion). More specifically, the first step was to detect suspect cases (fever and cough), followed by imaging for characteristics of pneumonia to finally confirm cases of infection. The post-peak stage (IV) lasted from February 19 to March 4 (weeks 11-12), when preliminary control of the pandemic was achieved (Figure 4a). After week 13, the coronavirus gradually receded, marking the commencement of the receding stage (V) (Figure 4a). However, China is still facing risks of imported cases (e.g., from Russia and the UK) and sporadic or local resurgence (e.g., Urumqi and Beijing) as well as asymptomatic infections. For example, 262 new cases were detected in Beijing from June 12 to 26. China has been working to reopen the factories and schools closed for the pandemic in an orderly manner, but caution should be exercised to prevent local resurgence.
The time of the COVID-19 outbreak in the US is later than in China. In the first 5 months (2019/01/21-2020/06/21), the US-outbreak had evolved through the first three stages: initiation (I), pre-peak (II), and peak (III). It was unclear whether the US has entered the post-peak stage (IV) (Figure 4b). In other words, in weeks 1-6, the NCC was less than 10, and the CCC did not reach 100 until March 3, 2020, i.e., initiation stage (I). The pre-peak stage (II) lasted from weeks 7 to 11, when the number of infections rapidly increased by thousands of new cases a day. Note that the NCC of the US exceeded that of China on March 10 (Figure 4b). The peak stage (III) lasted from weeks 12 to 16, when the number of infections dramatically increased at 30,000-40,000 new cases a day. Since week 17 (early May), the NCC has continued to fluctuate at high levels and was sustained above 20,000, showing no obvious signs of receding (Figure 4b). The NCC showed a slight downward trend in the whole May, but the CCC had already exceeded one million. In June, however, the NCC kept increasing slightly and was sustained at the 20,000-30,000 level, indicating out-of-control the spread of COVID in the US. From the view of the NCC or the speed of spread, both China and the US experienced a 6-week initiation stage (when the NCC stayed at low levels). Particularly, the outbreak in the US occurred approximately one month later than that in China in terms of both the initiation and pre-peak stages.
3.1.3 Cumulative number of deaths and mortality rate
As shown in Figure 5, the cumulative number of deaths in China stabilized in early March, whereas that in the US had continued to increase since mid-March. The mortality rate in the US (2.8%) was lower than that in China (5.5%). However, the total number of cumulative deaths in the US has already exceeded 210,000 on June 20, more than 45 times that in China. In China (Figure 5a), the first death was reported on January 11, the cumulative number reached 100 on January 28, increased rapidly in weeks 8-12, increased slowly at week 13, and finally stabilized at about 3500. The number increased by 1000 on April 17 as a result of screening and verification of deaths that had not been reported previously, but no new deaths have been reported since then. In terms of the provincial distribution, China showed a highly concentrated distribution. More specifically, the number of deaths in Hubei Province accounted for 97% of the national total within Wuhan accounting for more than four-fifths of the provincial total, followed by Henan (0.5%, 22 deaths), Heilongjiang (0.3%, 13 deaths), Beijing (1.5%, 9 deaths), and Guangdong (1.2%, 8 deaths). In addition, as the “epicenter” of the outbreak in China, Hubei Province (with a CCC of 68,000) had a high mortality rate of 6.6%, much higher than that of other provinces (0.8%). Recent work suggests that the different mortality rates of COVID-19 infections in Hubei and other provinces are closely related to the availability of medical resources (Ji et al., 2020; Li et al., 2020a). On the one hand, the soaring number of infections in Wuhan resulted in a scarcity of local medical resources, which had a negative impact on patient treatment (Ji et al., 2020). On the other hand, the coronavirus attacked other provinces later, and the medical experience obtained in Hubei Province contributed to more timely infection detection and treatment in those provinces (Li et al., 2020a).
Figure 5.
Comparisons of the cumulative deaths of COVID-19 between China and the USFrom the respect of the cumulative deaths in the US (Figure 5b), the first death was reported on February 29 and kept increasing in March, from less than 10 to 5568 at the end of the month, and the US number exceeded that of China on March 29. In April, the deaths dramatically increased by about 10-fold from 6787 to 63,000. In May, deaths reached 100,000, and as of June 20, there were approximately 120,000, accounting for one-fourth of the global total. In other words, the cumulative number of US deaths increased slowly and stayed relatively low in weeks 1-8 but has increased rapidly since then (y=1698.7x-13,979, R2=0.985). In terms of the distribution of deaths in individual states, the cumulative number of deaths of New York accounted for more than one-quarter (31,000 deaths) of the national total, with New York City accounting for more than 70% of the state total, followed by New Jersey (1/10, 13,000 deaths). During the study period of January 22 to June 20, 2020, the cumulative number of deaths in each of the 19 states accounted for more than 1/100 of the national total, including Massachusetts (8000), Illinois (7000), Pennsylvania (6000), Michigan (6000), and California (5000). The average mortality rate of the aforementioned 21 states (5.3%) was roughly equal to the nationwide average mortality rate. In particular, the mortality rate in New York State was as high as above 8.0%.
3.2 Spatial variations and geographical transmission process
The spatio-temporal transmission characteristics of the COVID-19 outbreak in China (Figure 6) and the US (Figure 7) were compared using the CCC and the CCC per 10,000 people at 10 critical time points (Table 1). The correlations between transmission features and population-economic densities were also investigated. Owing to the impact of factors such as population flow and transport (Ding et al., 2020a), the COVID-19 spread rapidly in both countries after the CCC reached 100. However, there were also significant differences between the two countries. In China, the coronavirus emerged in Wuhan city and spread to other regions of Hubei Province and then other regions. It exhibited an overall a cross(“+”)-shaped transmission route, i.e., along the Beijing-Guangzhou railway in the south-north direction and along the Yangtze River in the west-east direction, and showed an overall distribution characterized by a high concentration with limited spread. Within 6-8 weeks of initiation, the NCC decreased to 100, and nationwide eruptions were prevented. In contrast, the COVID-19 started spreading in the US in early March, with New York state as the center. High concentrations of widespread infections finally led to multiple region eruptions throughout the country. The coronavirus has raged through the US for over 20 weeks and continues to spread.
Figure 6.
Spatio-temporal dynamics process of the CCC as well as NCC and CCC per 10,000 people of COVID-19 at critical time points in China and its provinces
Figure 7.
Spatio-temporal dynamics process of the CCC as well as NCC and CCC per 10,000 people of COVID-19 at critical time points in the US and its states| China | the US |
|---|
| Timeline | Interval days | CCC | | Timeline | Interval days | CCC |
| 1 | 2019/12/8 | - | 1 | 1 | 2020/1/22 | - | 1 |
| 10 | 2020/1/1 | 25 | 27 | 10 | 2020/2/3 | 13 | 11 |
| 100 | 2020/1/18 | 17 | 121 | 100 | 2020/3/3 | 29 | 18 |
| 1000 | 2020/1/25 | 7 | 1409 | 1000 | 2020/3/11 | 8 | 1285 |
| 10,000 | 2020/2/1 | 7 | 11,901 | 10,000 | 2020/3/19 | 8 | 13,748 |
| 20,000 | 2020/2/4 | 4 | 23,718 | 100,000 | 2020/3/27 | 8 | 101,962 |
| 40,000 | 2020/2/10 | 6 | 42,372 | 500,000 | 2020/4/11 | 15 | 526,776 |
| 60,000 | 2020/2/14 | 4 | 66,376 | 1,000,000 | 2020/4/28 | 17 | 1,012,582 |
| 80,000 | 2020/3/2 | 17 | 80,177 | 2,000,000 | 2020/6/10 | 43 | 2,000,464 |
| Active cases | 2020/6/20 | - | 403 | Active cases | 2020/6/20 | - | 1,235,657 |
Table 1.
Dynamics of the COVID-19 CCC at critical time points in China and the US
As shown in Figure 6, from early December 2019 to mid-January 2020 (about 6 weeks), infections in China were highly concentrated in Hubei Province. From late January to early February, the COVID-19 spread nationwide into 34 provinces and municipalities. During the outbreak, the coronavirus emerged in Wuhan and then spread to the entire Hubei. Due to high rates of travel (home-bound population flow) before the Chinese New Year (Ding et al., 2020a; Liu et al., 2020), the virus spread nationwide. In the peak stage of the outbreak, only four provinces (Guangdong, Henan, Zhejiang, and Hunan) reported the CCC above 1,000 on 20 June, the CCC of Hubei Province exceeded 60,000, and more than 10 provinces/autonomous regions (including Tibet, Xinjiang, Taiwan, Qinghai, and Gansu) reported the CCC below 100, indicating that the infections were highly concentrated. The NCC outside Hubei Province gradually decreased after February 12. From late February to early March, the NCC stayed at high levels of 200-500, but those in other provinces were less than 20, indicating effective control of the spread. Spatially, the outbreak in China was predominantly concentrated in Hubei (Wuhan); outside Hubei, the impact was mainly felt in Guangdong, Henan, Hunan, and Beijing as well as Zhejiang, Anhui, Sichuan, Jiangsu, exhibiting a cross(“+”)-shaped transmission route (i.e., along the Yangtze River and the Beijing-Guangzhou Railway) (Figure 6). From late March to early April, as the pandemic raged globally, China faced a severe risk of virus importation, especially in border areas and coastal provinces, such as Heilongjiang, Inner Mongolia and Fujian. Currently, infections in Beijing and associated cases in other provinces (e.g., Hebei, Liaoning, and Sichuan) were the major concern, with approximately 400 cases reported in early to mid-June. Overall, the outbreak in China lasted a relatively short period of about 6 weeks. Nationwide eruptions were prevented, with “a high concentration and small spread” as the major characteristics. The outbreak in China had now evolved into the stage of preventing imported infections and local resurgences (e.g., Beijing and Urumchi).
As shown in Figure 7, the COVID-19 continued to spread in the US, and effective containment remains to be realized. The US has been implementing a laissez-faire policy (e.g., residents not advised to wear face masks until April 3) in the COVID-19 battle and had limited access to reliable testing. In addition, no restrictions were imposed on European air travel. Owing to these factors, the coronavirus, which initiated in just a few states (e.g., Washington, New York, and California), spread rapidly to all 50 states in less than 3 weeks, leading to nationwide eruptions. In April, the US outbreak accelerated at thousands of new cases a day, especially in the northeast (New York, New Jersey, and Massachusetts), west (California), and Midwest (Illinois). In May and June, there were 20,000-30,000 new cases a day, with 7/10 (37) of the states reporting more than 100 new cases a day and 7 states (including New York, Illinois, New Jersey, and California) reporting more than 1,000 new daily cases. These nationwide eruptions revealed high concentrations and extensive spread (Figure 7). Overall, the outbreak in the US has lasted more than 20 weeks with continued widely transmission. Spatially, the initial outbreak was more serious in the western and eastern coastal states, such as New York (New York City), New Jersey (Hudson County), Illinois (Cook County), Massachusetts (Middlesex County), and California (Los Angeles County).
Statistical analyses revealed relationship between COVID-19 transmission (as measured using CCC and number of deaths) and the population and economic densities in both countries (Sun et al., 2020). In China, there was a certain correlation between the CCC and economic density (Figure 8c), with the correlation coefficient R2 equal to 0.592 (y= 31.397x0.4567), followed by the correlation between the CCC and population density (Figure 8a), with R2=0.501 (y=2082.6x1.2777). That between the cumulative deaths and population density (Figure 8b) was R2=0.426 (y=30.32x0.1372), and the correlation between the cumulative deaths and economic density (Figure 8d) was R2=0.479 (y=336.6x0.2811). Related research shows that COVID-19 transmission is closely correlated with population mobility and economic vitality (Liu et al., 2020; Sun et al., 2020). For example, 5 million people traveled out of Wuhan before the Chinese New Year, which contributed to the early accelerated spread of COVID-19 in China (Liu et al., 2020).
Figure 8.
Correlations between the CCC and population, cumulative deaths and population, the CCC and GDP, cumulative deaths and GDP in China (excluding Hubei Province) and the USIn the US, the relationships between the CCC and population and economic densities were higher than those between the cumulative deaths and population and economic densities. The coefficients of correlation between the CCC and population density (Figure 8e), cumulative deaths and population density (Figure 8f), CCC and economic density (Figure 8g), and cumulative deaths and economic density (Figure 8h) were 0.703 (y=19364x0.5861), 0.664 (y=254666x0.4719), 0.701 (y=164.33x0.7515), and 0.691 (y=1218.2x0.6178), respectively. As noted in the Public Health Response to the Initiation and Spread of Pandemic COVID-19 in the US, from February 24 to April 21, 2020 by the US CDC, the major reason for rapid and wide spread in the US was the failure to restrict large-scale domestic population flows and travel from European countries in a timely manner.
4 Timelines of the COVID-19 and the strategies in China and the US
Identifying the spatio-temporal transmission paths of COVID-19, assessing governmental strategies, and understanding the real impacts of the virus in individual countries can help predict future trends and contain spread. To support the international community in the global COVID-19 battle, we made systematic efforts to delineate the timelines of the outbreaks in China and the US and assess both countries’ strategies from three perspectives, including confirmed cases or death, governmental actions, and medical measures (Figure 9).
Figure 9.
Timelines of COVID-19 developments in China and the USOn December 8, 2019, the first confirmed cases of COVID-19 were identified in Wuhan city, Hubei Province. In early January 2020, China firstly reported the situation to the WHO, shared the genetic sequence of the virus, and then took various measures to contain its spread, such as home/concentrated quarantines, transport restrictions, lockdown of Wuhan (Jan. 23), and establishment of mobile cabin hospitals (Fangcang). The WHO published comprehensive technical guidelines and, based on the existing knowledge of COVID-19, provided recommendations for virus identification, testing, and management. In January 2020, China and the WHO jointly issued alerts on COVID-19. Unfortunately, these early-warning information did not receive adequate attention in some countries, such as the US. Only except for imposing restrictions on travel to and from China, the US did not take any other measures to prevent and control the coronavirus. In addition, the US initially lacked effective tests and then established a high barrier for testing, resulting in nationwide spread. Obviously, slow actions were used in both countries accelerated the spread of COVID-19 in the early stage of the outbreaks. The variable consequences of the pandemic on China and the US can be explained by the different non-medical interventions (e.g., lockdowns and quarantines) and medical interventions (e.g., building mobile cabin hospitals and providing adequate protective materials). In particular, in terms of the attitude toward and the effectiveness of the measures taken against the pandemic, both countries have different medical systems, culture and living habits, and testing standards.
4.1 Timelines and mitigation strategies of COVID-19 in China
On December 8, 2019 (announced on January 11, 2020), suspected cases of COVID-19 were reported to Wuhan Health Commission (Figure 9). In late January, the CCC in Hubei Province remained below 100. By the end of January, confirmed cases were reported in other provinces (including Beijing, Guangdong and Hunan). In early February, the CCC peaked at 80,000 at the end of February and then gradually stabilized. But, most encouragingly, the governmental unprecedented and high-pressure measures were used to successfully control the spread of COVID-19, reflecting the altruism and solidarity of the Chinese people and their great trust in and firm support of the government (Wigginton et al., 2020). The COVID-19 battle in China was centered around the self-quarantine of all residents, with lockdowns, community control, and risk rating as the basic policies, and nucleic acid testing (NAT) and the use of protective garments and face masks as the fundamental measures to reduce transmission. In some sense, the strategies employed by China did reduce economic benefits. These can be summarized as follows:
Firstly, in the early stage, there were inaccurate assessments of the risk of the COVID-19, which increased the difficulty combating its spread in the later stages. In later December 2019, person-to-person transmission of the virus happened among close contacts (Li et al., 2020a). In early January 2020, seven medical personnel were infected. However, National Health Commission of China still reported to the public on January 10 that “no obvious evidence of person-to-person transmission was found”. On January 20, Zhong Nanshan, a member of the Chinese Academy of Engineering and a member of the National High-Level Expert Group, publicly announced the risk of person-to person transmission. That is, inaccurate assessments persisted for 6 weeks of the outbreak and considerably reduced the ability of the general public and even medical personnel to take protective measures, which hampered prevention and control efforts in later outbreak stages (Ding et al., 2020b). For example, almost all of the nationwide confirmed cases reported on January 25 originated from Wuhan (Wang et al., 2020).
Secondly, nationwide, high-pressure prevention and control measures were quickly implemented to contain the spread of COVID-19. On January 23, Wuhan was put on lockdown, followed by nationwide strict control measures, including community/concentrated quarantines, accelerated building of mobile cabin hospitals (e.g., the Huoshenshan and Leishenshan), as well as efforts to increase NAT capacity, medical professional mobilization, and increasing the production and supply of pandemic prevention and control materials (Sun et al., 2020). Under government leadership, the Chinese people united together, and the military and civilian sectors made concerted efforts to implement prevention and control measures, such as transport restrictions, closures of public facilities, and home quarantine. As a result, the situation improved, with the NCC reduced to below 100 in early March. As predicted by a natural spread model, the number of infections would have reached 10 million in mid-February if effective measures had not been taken (Huang et al., 2020b). In contrast, the actual number of infections was approximately 70,000. Obviously, these high-pressure measures played a huge role in China’s successful containment of the spread of COVID-19.
Thirdly, factories and schools were reopened in an orderly manner to achieve an optimal balance between the pandemic battle and economic recovery. As the first country to effectively deal with the coronavirus, China’s success came at huge socioeconomic costs. The Central Leading Group for COVID-19 Prevention and Control as led by Chinese President Xi Jinping, took the life safety and physical health of the people as the top priority and worked toward the overarching goal of resolutely winning the pandemic battle. Importantly, the center of the outbreak and the hardest-hit areas in China, Wuhan city came out of lockdown on April 8. In fact, implementing scientific strategies for removing lockdowns was critical to continuously containing the spread of the coronavirus. China continues to gradually reopen factories and schools in an orderly manner (Tian et al., 2020) while focusing on preventing imported infections and domestic local resurgence. For example, medical aid to Heilongjiang and other border areas and NAT screening for all residents of Wuhan. In addition, rent, credit, and tax incentive measures targeting various industries have been implemented to reduce the socioeconomic impact of the pandemic.
4.2 Timelines and mitigation strategies of COVID-19 in the US
As shown by the timelines of COVID-19 in the US (Figure 9), the CCC stayed below 20 from late January to the end of February 2020. And then, infections in persons with no travel to affected areas and in non-contacts were reported, indicating that COVID-19 had started spreading domestically. The coronavirus has spread rapidly since mid-March, with the CCC reaching above two million and the number of deaths exceeding 0.1 million in June, and it continues to spread. The slow actions of the federal, state and local governments meant that the best opportunity to contain the virus was missed. The limitations of the US COVID-19 prevention and control strategies can be described as follows:
Firstly, to some extent, it was slow actions to cope with Europe-imported cases that resulted in the initial eruptions. On January 31, the US announced restrictions on the movement of non-US citizens from China (effective on February 2). However, two million travelers from Italy and other severely affected European countries traveled to the US in the month of February. On March 3, the CCC exceeded 100. Despite awareness of the pandemic in Europe and the presence of imported infections, the US did not announce restrictions on travelers from European countries until March 11, when the CCC had already exceeded 1000. These slow actions accelerated the spread of COVID-19 in New York State and western coastal areas (e.g., California) in the early stage of the outbreak. Indeed, gene sequencing of the virus samples collected from metropolitan New York in March showed that the virus strain was from Europe (Forster et al., 2020).
Secondly, failure to restrict large gatherings and domestic population flows has also accelerated COVID-19 spread. In February, the CCC stayed below 100 in the US. At that time, the US government did not restrict large gatherings, such as Mardi Gras festivities attended by one million people in Louisiana in mid-to-late February. In particular, the coronavirus task force led by the US Vice President Mike Pence claimed that “the COVID-19 will not spread in communities”. Obviously, large-scale domestic population flows played an important role in the transmission and accelerated spread of the coronavirus in the early stage of the outbreak in March. Currently, the majority of the US domestic infections originate from community transmission.
Thirdly, lack of necessary protective equipments is an important factor of increased the difficulty of COVID-19 prevention and control. The lack of materials such as face masks and protective garments led to the persistence of the virus in high-risk places (e.g., hospitals and medical institutions), public facilities (e.g., supermarkets), and densely populated areas (e.g., New York City), thereby accelerating COVID-19 spread in the US. For example, the US CDC did not recommend the wearing of face masks to minimize the risk of viral transmission until early April, when the CCC had exceeded 200,000.
Finally, laissez-faire policies and a high barrier for testing in the early stage have also accelerated COVID-19 spread. The outbreak overlapped with the end of the seasonal influenza wave in the US. The local disease monitoring systems failed to distinguish the two viruses in a timely and effective manner. A laissez-faire policy adopted in the early response to the COVID-19 outbreak and limited testing resulting in widespread transmission that was not detected in the early stage of the outbreak. The CCC in the US reached one million from late April to early May and reached surprisingly two million in early June, and the NCC has continued to increase. Also, the asymptomatic infections were potential risks for prevention and control of COVID-19.
The continuing spread of COVID-19 has had profound impacts in the US, such as plunging stock prices and tens of millions of people unemployed. As state stay-at-home orders expired in May, the states were biased by economic considerations. For example, half of the states (e.g., Texas and Georgia) have already relaxed control measures to revitalize their economies. COVID-19 spread was contained to a certain degree near the end of April in Georgia, Louisiana, and Texas. However, the resumption of economic activities was followed coronavirus resurgence. From the resumption of economic activities to October 10, the CCC of the aforementioned three states had increased by 304,005, 142,877, and 787,188, respectively.
5 Conclusions and discussion
5.1 Conclusions
In this study, using a real-time dataset (including the CCC, CCC per 10,000 people, NCC, cumulative number of deaths, mortality rate, and active cases), the spatio-temporal transmission characteristics and timelines or coping strategies of COVID-19 outbreaks in China and the US were comparatively investigated. This research aimed to understand the spatio-temporal characteristics, development dynamics and actual processes of COVID-19, and provide the basic support for facilitating international cooperation to monitor and control the pandemic. Some conclusions in the above analyses are as follows:
(1) Temporally, both China and the US have about a 6-week initiation stage of the coronavirus before it erupted. In China, eruption occurred in late January of 2020, the peak of the NCC in early to mid-February and then gradually decreased. The outbreak in China is now receding, with the outbreak basically contained in a short period of 6-8 weeks. In contrast, the coronavirus erupted in the US in early March and had continued for more than 20 weeks. The outbreak is evolving in the peak or post-peak stage, and the coronavirus continues to spread at speeds of 20,000-30,000 new cases a day, with no effective control of the coronavirus.
(2) Spatially, in China, COVID-19 was initiated in Wuhan and spread to the entire Hubei region and other provinces, exhibiting a cross(“+”)-shaped path of spread along the Beijing-Guangzhou railway in the south-north direction and along the Yangtze River in the west-east direction, with Hubei Province (Wuhan city) as the center. Although the concentration of infections was high, the spread range was small, and nationwide eruptions of the coronavirus were prevented. In contrast, the coronavirus was erupted from multiple locations across the US, with New York, New Jersey, Illinois, and California as the original centers. The high concentrations of infection were spread across the entire country. So far, large-scale spread of the US-COVID-19 was continuing.
(3) Owing to the different medical systems, culture and living habits, and testing standards, the outbreaks process of COVID-19 varied in China and the US. Despite poor assessment of the risk of the coronavirus that persisted for 6 weeks in the early stage of the outbreak, China then took proactive public health interventions and high-pressure prevention measures. As a result, China contained the coronavirus spread in early March and then resumed business activities in an orderly manner in April. In the latest developments of the outbreak in China, the focus is on preventing imported infections and domestic regional resurgence. In contrast, the US failed to restrict European air flights and domestic population flows and suffered from a shortage of necessary protective materials in early March, missing the best opportunity to contain the epidemic. In early May, half of the states has been removed previously implemented restrictions and gradually resumed business activities. Since then, the US had been facing the double pressures of continuing spread and resurgence of COVID-19.
5.2 Discussion
As the global COVID-19 pandemic enters an increasingly complicated stage, the world’s countries face tremendous upheaval and disrupted social security. In particular, the pandemic has caused huge negative impacts on American and European countries. China had achieved notable successes in the COVID-19 battle, made huge efforts in preventing the exportation of coronavirus, and won valuable time for other countries. However, COVID-19 pandemic continued to worsen outside China, and the country will face risks of sporadic and concentrated coronavirus eruptions for the foreseeable future (Li et al., 2020b). The current focus in China is to prevent coronavirus resurgence and local eruptions while recovering economic order. In addition, considering that China is neighbored by large countries in terms of both population and CCC (20 countries with a total of active cases about 1.30 million (10.21 million CCC in total) in October 10, 2020), the prevention of imported infections and domestic resurgence will remain a top priority in the COVID-19 battle. As of October 10, China had a total of 3029 imported cases, with approximately three-fourths of the imports distributed in border areas such as Heilongjiang, Inner Mongolia, Guangdong, and Yunnan. As efforts are being made to reopen factories and schools and resume normal social activities, it is recommended to conduct nationwide NAT screening of the coronavirus as has been done in Wuhan. The scope of NAT screening should be expanded as much as possible, and it should be conducted strictly and quickly so that the sources can be identified and tracked. Local resurgence of the coronavirus should be strictly monitored and controlled to prevent large-scale eruptions.
The spread of the coronavirus remains in the peak (fluctuating) stage in the US; as the “epicenter,” it is a severely afflicted area in the global pandemic. The US performance fully demonstrated that the government took a laissez-faire COVID-19 prevention and control policy, which must be improved. Even when the coronavirus pandemic was far from over, many states removed the lockdowns implemented to contain the spread in March and April to revitalize the economy. In addition, increasingly large protests further accelerated the spread of the coronavirus. For example, the number of infections increased by 7000 within 2 weeks (from May 30 to June 12) in Minnesota, the epicenter of the protests. Based on the US government’s COVID-19 prevention and control strategies and the fact that the coronavirus is still rapidly spreading, it will continue to rage through the US at increasing speeds throughout the summer of 2020. Their new confirmed cases increased dramatically 4.55 million from July to September, which is the best proof of their worse epidemic prevention. As the weather cools and seasonal influenza resurges, the CCC of the coronavirus will likely increase in autumn and winter. For example, the NCC reached a record high of about 0.50 million in early October in the USA. Based on the successes of China and Korean Peninsula in the COVID-19 battle and the latest developments of the pandemic, only strict prevention and control measures can effectively contain coronavirus spread (Sun et al., 2020). Obviously, social distancing and lockdown suppression can be the most effective non-medical actions (Lai et al., 2020; Li et al., 2020c). Therefore, we argue that global COVID-19 pandemic (including the US) demands joint interventions for the suppression of present and future waves, especially learning and promotion from the successfully epidemic prevention experience of China (Li et al., 2020c).
References
[1] AlastairB, RichardH. A planetary health perspective on COVID-19: A call for papers. The Lancet, 395, 1099(2020).
[2] Andersen KG, RambautA, Lipkin WI et al. The proximal origin of SARS-CoV-2. Nature Medicine, 26, 450-452(2020).
[3] Brooks CP, AntonovicsJ, Keitt TH. Spatial and temporal heterogeneity explain disease dynamics in a spatially explicit network mode. The American Naturalist, 172, 149-159(2008).
[4] Chen NS, ZhouM, DongX et al. Epidemiological and clinical characteristics of 99 cases of 2019 novel coronavirus pneumonia in Wuhan, China: A descriptive study. The Lancet, 395, 507-513(2020).
[5] Chen SM, Yang JT, Yang WZ et al. COVID-19 control in China during mass population movements at New Year. The Lancet, 395, 764-766(2020).
[6] Chen TM, RuiJ, Wang QP et al. A mathematical model for simulating the phase-based transmissibility of a novel coronavirus. Infectious Diseases of Poverty, 9, 24(2020).
[7] de WitE, FeldmannF, CroninJ et al. Prophylactic and therapeutic remdesivir (GS-5734) treatment in the rhesus macaque model of MERS-CoV infection. Proceedings of the National Academy of Sciences of the United States of America, 117, 6771-6776(2020).
[8] DingL, CaiW, Ding JQ et al. An interim review of lessons from the Novel Coronavirus (SARS-CoV-2) outbreak in China. Scientia Sinica Vitae, 50, 247-257(2020).
[9] DingY, Luo SH, Zheng XY et al. Association between population migration and epidemic control of coronavirus disease 2019. Science China Life Sciences, 63, 936-939(2020).
[10] Dong ES, Du HR, GardnerL. An interactive web-based dashboard to track Covid-19 in real time. The Lancet Infectious Diseases, 20, 533-534(2020).
[11] ForsterP, ForsterL, RenfrewC et al. Phylogenetic network analysis of SARS-CoV-2 genomes. Proceedings of the National Academy of Sciences of the United States of America, 117, 9241-9243(2020).
[12] Franch-PardoI, Napoletano BM, Rosete-VergesF et al. Spatial analysis and GIS in the study of COVID-19: A review. Science of the Total Environment, 739, 140033(2020).
[13] GhinaiI, McPherson TD, Hunter JC et al. First known person-to-person transmission of severe acute respiratory syndrome coronavirus 2 (SARS-CoV-2) in the USA. The Lancet, 395, 1137-1144(2020).
[14] Gu CL, ZhuJ, Sun YF et al. The inflection point about COVID-19 may have passed. Science Bulletin, 65, 865-867(2020).
[15] He JY, Chen GW, Jiang YT et al. Comparative infection modeling and control of COVID-19 transmission patterns in China, South Korea, Italy and Iran. Science of the Total Environment, 747, 141447(2020).
[16] Huang CL, Wang YM, Li XW et al. Clinical features of patients infected with 2019 novel coronavirus in Wuhan, China. The Lancet, 395, 497-506(2020).
[17] Huang EN, Qiao FL. A data driven time-dependent transmission rate for tracking an epidemic: A case study of 2019-nCov. Science Bulletin, 65, 425-427(2020).
[18] IppolitoG, Hui DS, NtoumiF et al. Toning down the 2019-nCoV media hype and restoring hope. The Lancet Respiratory Medicine, 8, 230-231(2020).
[19] Ji YP, Ma ZR, Peppelenbosch MP et al. Potential association between COVID19 mortality and health-care resource availability. The Lancet Global Health, 8, e480(2020).
[20] KupferschmidtK, CohenJ. Can China’s COVID-19 strategy work elsewhere?. Science, 367, 1061-1062(2020).
[21] Lai SJ, Ruktanonchai NW, Zhou LC et al. Effect of non-pharmaceutical interventions to contain COVID-19 in China. Nature, 585, 410-413(2020).
[22] LiQ, Guan,X H, WuP et al. Early transmission dynamics in Wuhan, China, of novel coronavirus-infected pneumonia. The New England Journal of Medicine, 382, 1199-1207(2020).
[23] Li RY, ChenB, ZhangT et al. Global COVID-19 pandemic demands joint interventions for the suppression of future waves. Proceedings of the National Academy of Sciences, 117, 26151-26157(2020).
[24] LiZ. Some enlightenment of the American medical insurance system to the current health system reform. China Health Insurance, 68-71(2018).
[25] Li ZJ, Chen QL, Feng LZ et al. Active case finding with case management: The key to tackling the COVID-19 pandemic. The Lancet, 396, 63-70(2020).
[26] LiuZ, Qian JL, Du YY et al. Multi-level spatial distribution estimation model of the inter-regional migrant population using multi-source spatio-temporal big data: A case study of migrants from Wuhan during the spread of COVID-19. Journal of Geo-information Science, 22, 147-160(2020).
[27] COVID-19 epidemic situation up to 24:00 on March 8th(2020). http://www.nhc.gov.cn/xcs/yqtb/202003/f2c83db9f73d4be5be0dc96af731813c.shtml/
[28] ShiP, Dong YQ, Yan HC et al. Impact of temperature on the dynamics of the COVID-19 outbreak in China. Science of The Total Environment, 728, 138890(2020).
[29] Sun ZB, Zhang,H, Yang,Y F et al. Impacts of geographic factors and population density on the COVID-19 spreading under the lockdown policies of China. Science of The Total Environment, 746, 141347(2020).
[30] Tian HY, Liu,Y H, Li,Y G et al. An investigation of transmission control measures during the first 50 days of the COVID-19 epidemic in China. Science, 368, 638-642(2020).
[31] Sustainable Development Goals: 17 Goals to Sustain Our World. New York: United Nations(2016). http://www.un.org/sustainabledevelopment/sustainable-development-goals/
[32] WangG, HuangE, Qiao FL. Quantitative evaluation on control measures for an epidemic: A case study of COVID-19. Chinese Science Bulletin, 65, 1009-1015(2020).
[33] Wigginton KR, Boehm AB. Environmental engineers and scientists have important roles to play in stemming outbreaks and pandemics caused by enveloped viruses. Environmental Science and Technology, 54, 3736-3739(2020).
[34] Coronavirus Disease (COVID-2019) Situation Reports(2020). https://www.who.int/emergencies/diseases/novel-coronavirus-2019/situation-reports/
[35] WrappD, Wang NS, Corbett KS. Cryo-EM structure of the 2019-nCoV spike in the prefusion conformation. Science, 367, 1260-1263(2020).
[36] COVID-19 is urged by the UN Secretary General to do everything possible to contain the outbreak(2020). http://www.xinhuanet.com/2020-02/29/c_1125642849.htm/
[37] Yang ZF, Zeng ZQ, WangK. Modified SEIR and AI prediction of the epidemics trend of COVID-19 in China under public health interventions. Journal of Thoracic Disease, 12, 165-174(2020).
[38] Zhou CH, Su FZ, PeiT et al. COVID-19: Challenges to GIS with big data. Geography and Sustainability, 1, 77-87(2020).
[39] ZhuN, Zhang DY, Wang WL et al. A novel coronavirus from patients with pneumonia in China, 2019. The New England Journal of Medicine, 382, 727-733(2020).