Author Affiliations
1Henan Key Laboratory of Infrared Materials & Spectrum Measures and Applications, Henan Normal University, Xinxiang 453007, China2Key Laboratory of Advanced Energy Materials Chemistry (Ministry of Education), College of Chemistry, Nankai University, Tianjin 300071, China3Institute of Physics, Henan Academy of Sciences, Zhengzhou 450046, China4e-mail: qinchaochao@htu.edu.cn5e-mail: yangyonggang@htu.edu.cnshow less
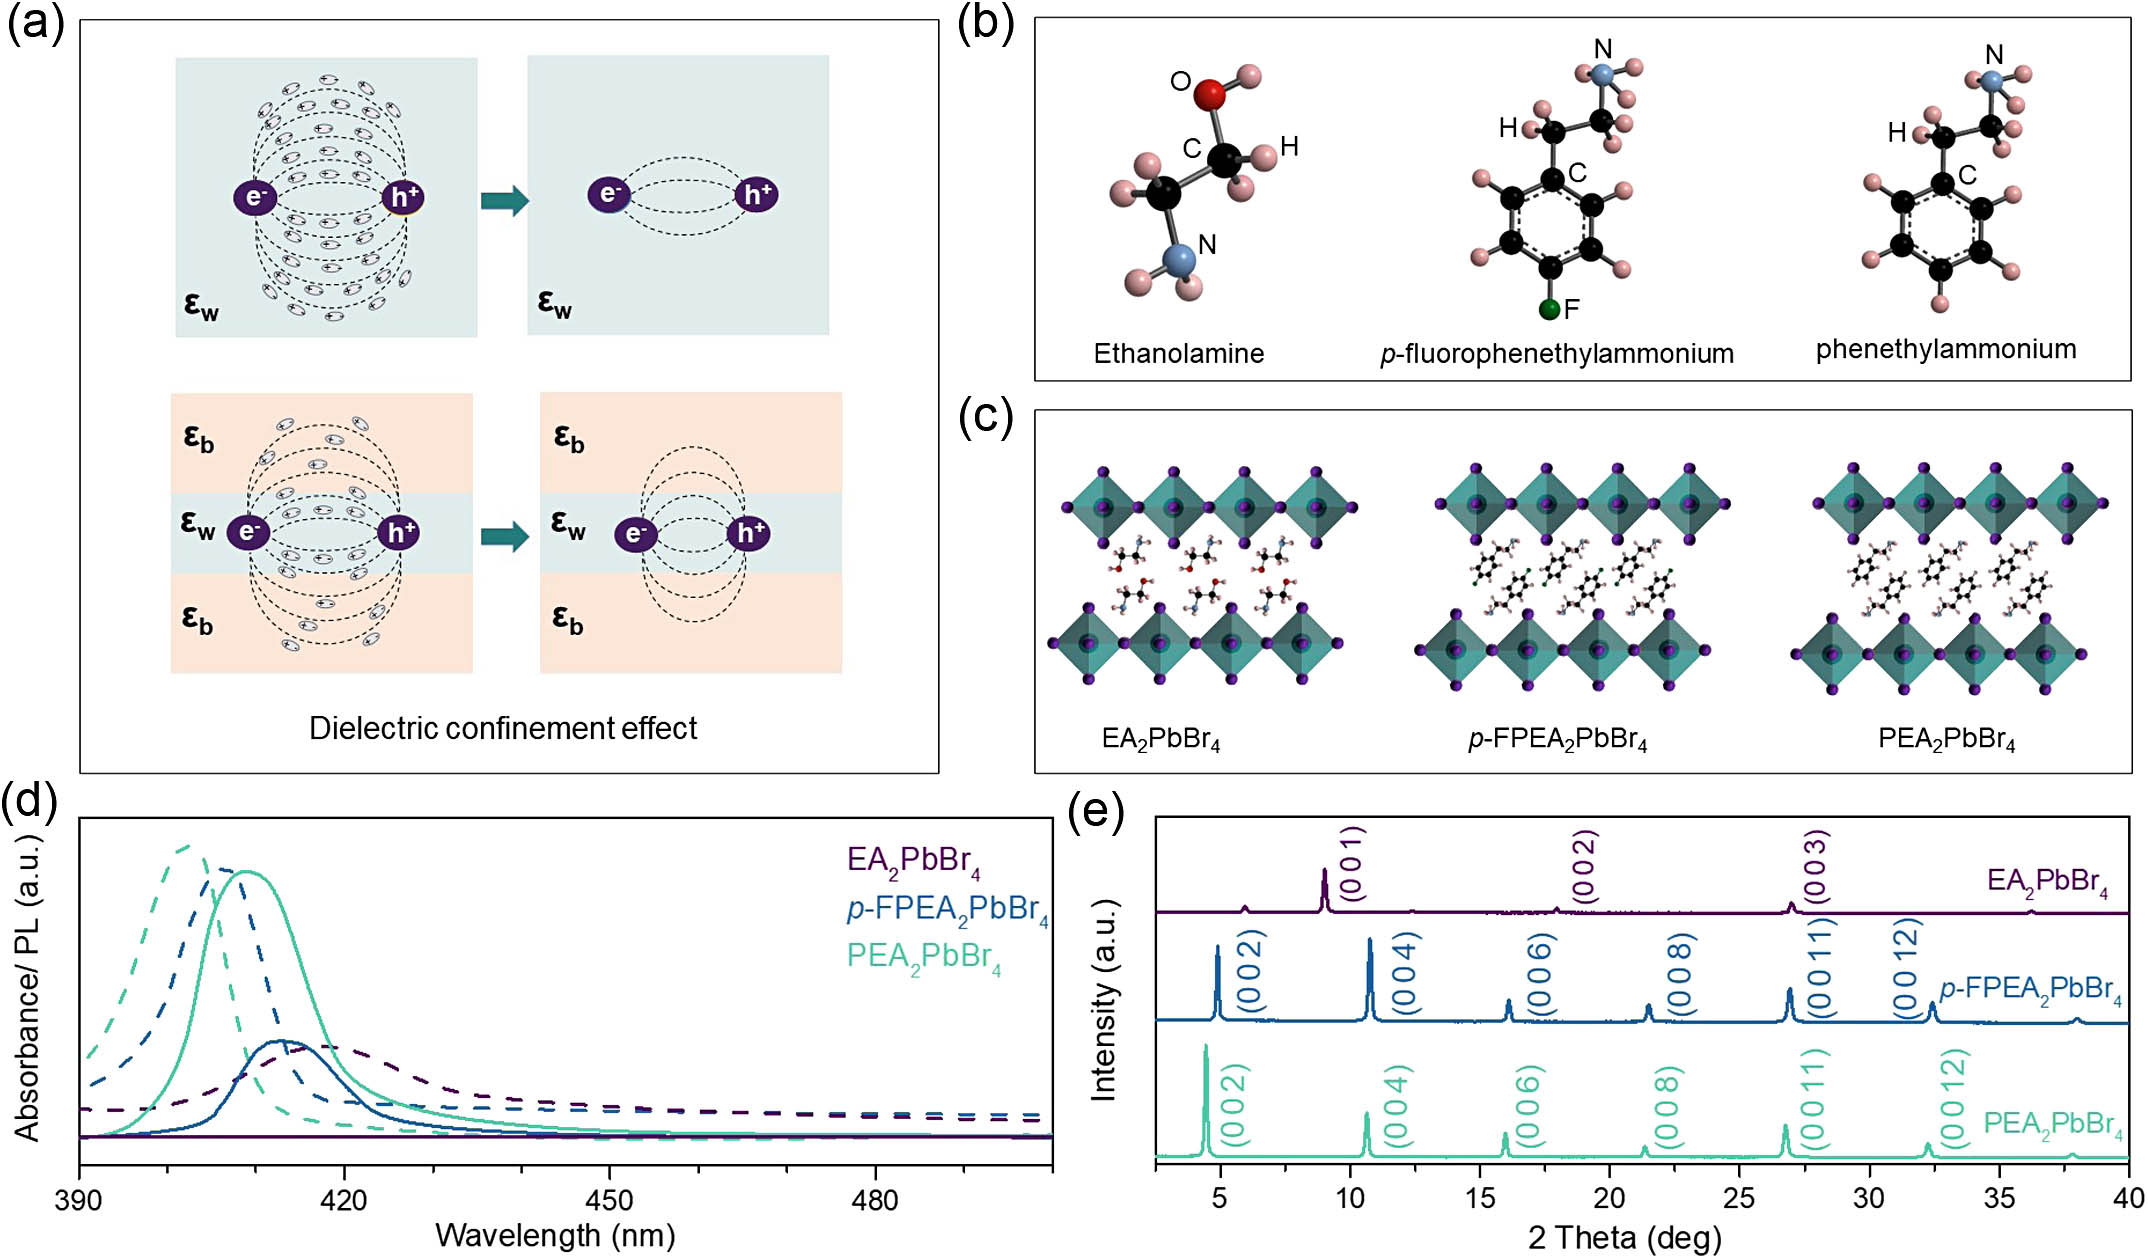
Fig. 1. (a) Schematic illustration of the dielectric confinement effect in a quantum well structure. Note that εw is much larger than εb. (b) Schematic molecular structures of ethanolamine (EA+), p-fluorophenethylammonium (p-FPEA+), and phenethylammonium (PEA+). (c) Schematic crystal structure of EA2PbBr4, p-FPEA2PbBr4, and PEA2PbBr4. (d) UV-vis absorption (dashed line) and steady-state PL (solid line) spectra of EA2PbBr4, p-FPEA2PbBr4, and PEA2PbBr4 perovskite films. (e) XRD patterns of EA2PbBr4, p-FPEA2PbBr4, and PEA2PbBr4 perovskite films.
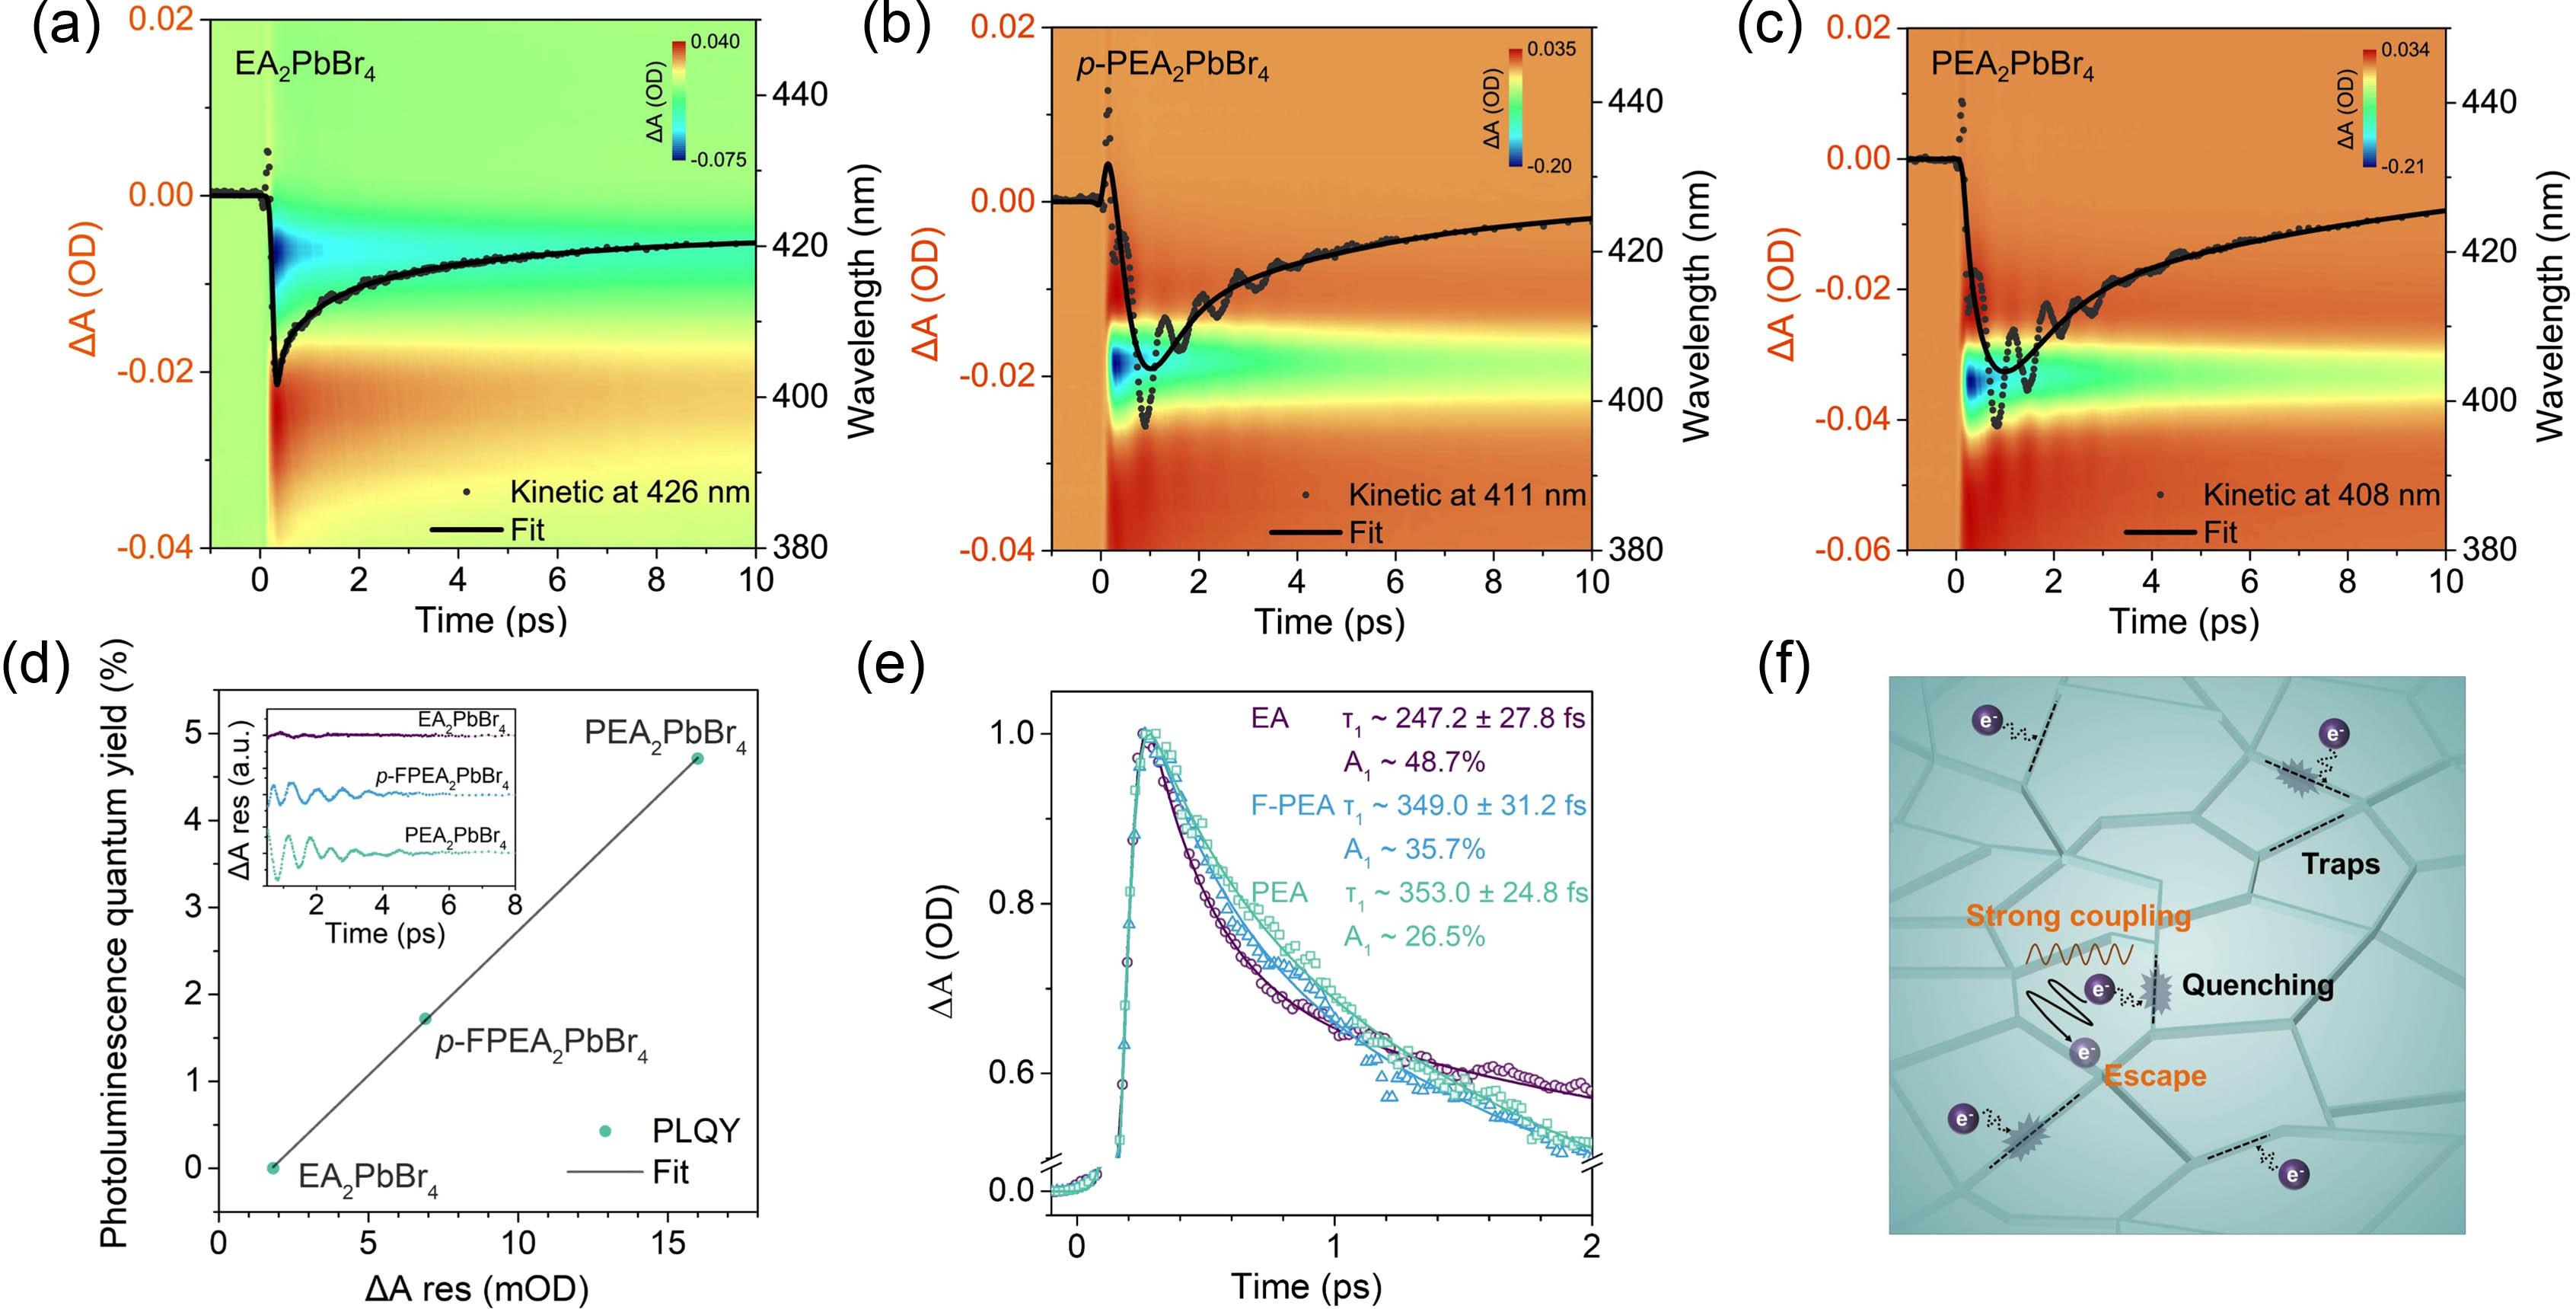
Fig. 2. TA spectra (vis-pseudocolor representation) and TA dynamics (black dots and lines) of a representative probe wavelength for (a) EA2PbBr4, (b) p-FPEA2PbBr4, and (c) PEA2PbBr4 perovskite films. Note: The orange coordinate scale corresponds to the TA dynamics of a representative probe wavelength, and the black coordinate scale corresponds to the TA spectra. (d) PLQYs as a function of maximum phonon modulation amplitude. Inset: Coherent phonon dynamics (the residuals after subtracting the contribution of exciton population from origin kinetics) of three perovskite films. (e) Population dynamics of EA2PbBr4, p-FPEA2PbBr4, and PEA2PbBr4 perovskite films. (f) Coherent phonon circumvents the defect capture process in perovskite thin films.
Fig. 3. (a) UV-vis absorption (dashed line) and steady-state PL (solid line) spectra of EA2MA3Pb4Br13, p-FPEA2MA3Pb4Br13, and PEA2MA3Pb4Br13 perovskite films. (b) XRD patterns of EA2MA3Pb4Br13, p-FPEA2MA3Pb4Br13, and PEA2MA3Pb4Br13 perovskite films. Temperature-dependent integrating PL intensity at different temperatures and corresponding fitting curves for (c) EA2MA3Pb4Br13, (d) p-FPEA2MA3Pb4Br13, and (e) PEA2MA3Pb4Br13 perovskite films. TA spectra (vis-pseudocolor representation) and TA dynamics (black dots and lines) of a representative probe wavelength for (f) EA2MA3Pb4Br13, (g) p-FPEA2MA3Pb4Br13, and (h) PEA2MA3Pb4Br13 perovskite films. Note: The orange ordinate scale corresponds to TA dynamics of a representative probe wavelength, and the black ordinate scale corresponds to TA spectra.
Fig. 4. (a)–(c) TA spectra at representative delay times of EA2MA3Pb4Br13, p-FPEA2MA3Pb4Br13, and PEA2MA3Pb4Br13 perovskite films, respectively. Inset: Transfer processes in population dynamics of three perovskite films. (d) PLQYs as a function of maximum phonon modulation amplitude. Inset: Coherent phonon dynamics of the three perovskite films. (e) Biexciton Auger recombination kinetics. The circles, squares, and triangles represent the two-by-two subtraction (P2–P1, P3–P2, and P3–P1) from the TA population dynamics at three different pump fluences (P1, P2, and P3). The biexciton Auger recombination lifetime (τ) is obtained by averaging the three time constants from the fittings using a single exponential function.
| (Weight/%) | (Weight/%) | (Weight/%) |
---|
| (48.7) | (26.8) | (24.5) | | (35.7) | (47.5) | (16.8) | | (26.5) | (55.6) | (17.9) |
|
Table 1. Fitting Parameters of the GSB Kinetics of ⟨n⟩=1 Quasi-2D RPP Films
| (mOD) | (mOD) | (mOD) | (mOD) | (mOD) | Transfer Ratio (%) |
---|
| −4.7 | — | — | — | — | 35.5 | | −1.3 | −7.4 | −3.2 | −0.5 | 6.7 | 54.0 | | −1.4 | −2.8 | −2.4 | −0.4 | 6.5 | 92.8 |
|
Table 2. Variation (ΔA, the last value—the initial value) of TA Population Dynamics and Transfer Ratio for EA2MA3Pb4Br13, p-FPEA2MA3Pb4Br13, and PEA2MA3Pb4Br13 Perovskite Films