Author Affiliations
1State Key Laboratory of Information Engineering in Surveying, Mapping and Remote Sensing, Wuhan University, Wuhan 430079, China1武汉大学测绘遥感信息工程国家重点实验室,武汉 4300792Autonavi Holdings Limited, Beijing 102200, China2高德软件有限公司,北京 102200show less
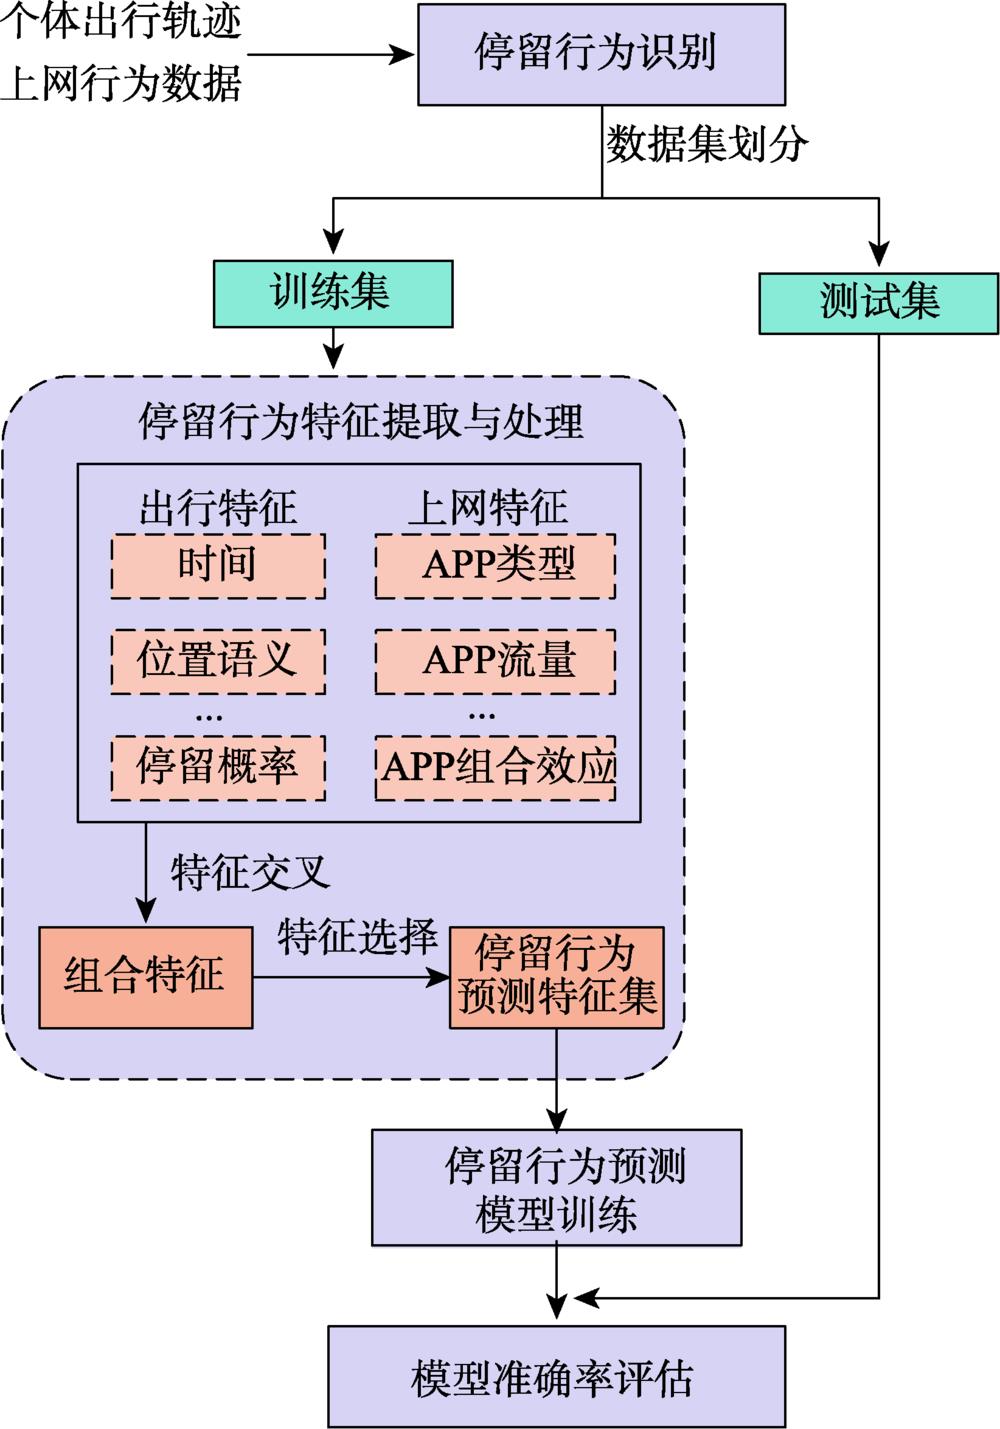
Fig. 1. Basic procedures of the individual stay behavior prediction method
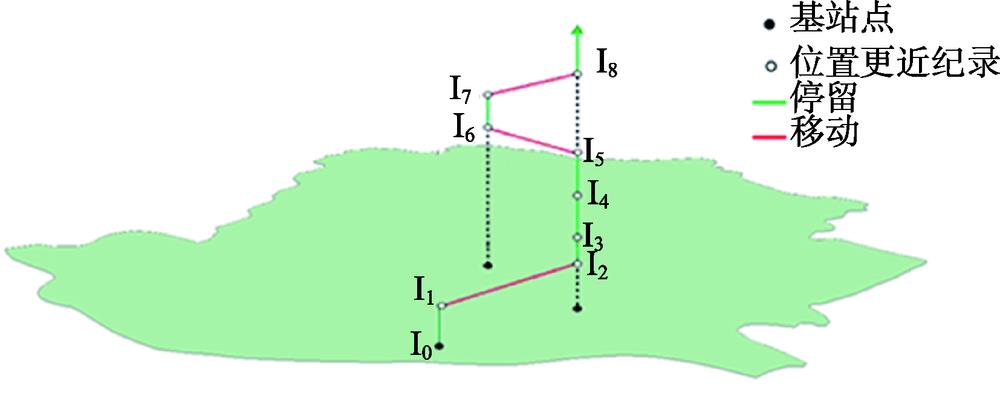
Fig. 2. The example of individual stay behavior
Fig. 3. Number of location update records for mobile users from Aug.10, 2015 to Aug.29, 2015
Fig. 4. The prediction accuracy distribution of mobile phone user stay behavior
Fig. 5. Comparison of mobile phone user stay behavior prediction results with different feature sets
Fig. 6. The chi-square value of the top20 stay behavior prediction features
用户ID | 日期 | 时间 | 事件类型 | 基站编号 | 基站经度/° | 基站纬度/° |
---|
58**** | 20YY-MM-DD | 07:30 | 1 | 11** | 115.**** | 29.**** | 58**** | 20YY-MM-DD | 08:30 | 5 | 11** | 115.**** | 29.**** | … | … | … | 3 | … | … | … | 58**** | 20YY-MM-DD | 21:30 | 4 | 10** | 115.**** | 29.**** | 58**** | 20YY-MM-DD | 22:30 | 10 | 11** | 115.**** | 29.**** |
|
Table 1. The examples of one user′s mobile phone location update data records
用户ID | 归属地 | 日期 | 时间 | 基站编号 | 经度/° | 纬度/° | APP | 流量/G |
---|
58*** | HB.WH | 20YY-MM-DD | 07:32 | 11** | 115.*** | 29.*** | 高德地图 | 0.0016 | 58*** | \N | 20YY-MM-DD | 08:32 | 11** | 115.*** | 29.*** | 微信 | 0.0092 | 58*** | \N | 20YY-MM-DD | 09:27 | 12** | 115.*** | 29.*** | QQ | 0.0242 | … | … | … | … | … | … | … | … | … | 58*** | \N | 20YY-MM-DD | 21:06 | 10** | 115.*** | 29.*** | 微信 | 0.0016 | 58*** | \N | 20YY-MM-DD | 21:34 | 11** | 115.*** | 29.** | 新浪新闻 | 0.0554 |
|
Table 2. The examples of one user′s Internet traffic data records
时段 | 移动/% | 停留/% | 无法识别/% |
---|
6 | 14.51 | 52.41 | 33.08 | 7 | 24.93 | 49.99 | 25.07 | 8 | 31.66 | 49.87 | 18.46 | 9 | 33.00 | 49.57 | 17.43 | 10 | 32.60 | 49.77 | 17.63 | 11 | 31.79 | 49.81 | 18.40 | 12 | 30.75 | 50.16 | 19.09 | 13 | 27.16 | 51.36 | 21.48 | 14 | 28.41 | 51.06 | 20.54 | 15 | 28.23 | 50.96 | 20.81 | 16 | 28.33 | 50.30 | 21.37 | 17 | 29.59 | 49.10 | 21.31 | 18 | 30.97 | 47.30 | 21.73 | 19 | 29.37 | 50.16 | 20.47 | 20 | 27.33 | 51.46 | 21.20 | 21 | 22.68 | 52.60 | 24.72 |
|
Table 3. The statistics of mobile phone user stay behavior from Aug.10, 2015 to Aug.29, 2015
地点 | 识别率/% |
---|
家 | 78.53 | 工作地 | 47.06 | 同时识别率 | 40.09 |
|
Table 4. The recognition rate of mobile phone users' home and work location from Aug.10, 2015 to Aug.29, 2015
预测模型 | 准确率/% | 运行时间/s | 参数设置 |
---|
本文模型 | 80.31 | 0.141 | | SVM | 77.35 | 3.996 | kernel='linear' probability=True | GBDT | 76.13 | 1.940 | n_estimators=200 | RF | 81.54 | 0.960 | n_estimators=200 | 一阶Markov | 71.75 | - | | MostValue | 69.45 | - | |
|
Table 5. Comparison of mobile phone user stay behavior prediction effects between different prediction algorithms