
Qing Wang, Haisong Xu, Jianqi Cai, "Chromaticity of white sensation for LED lighting," Chin. Opt. Lett. 13, 073301 (2015)
- Chinese Optics Letters
- Vol. 13, Issue 7, 073301 (2015)
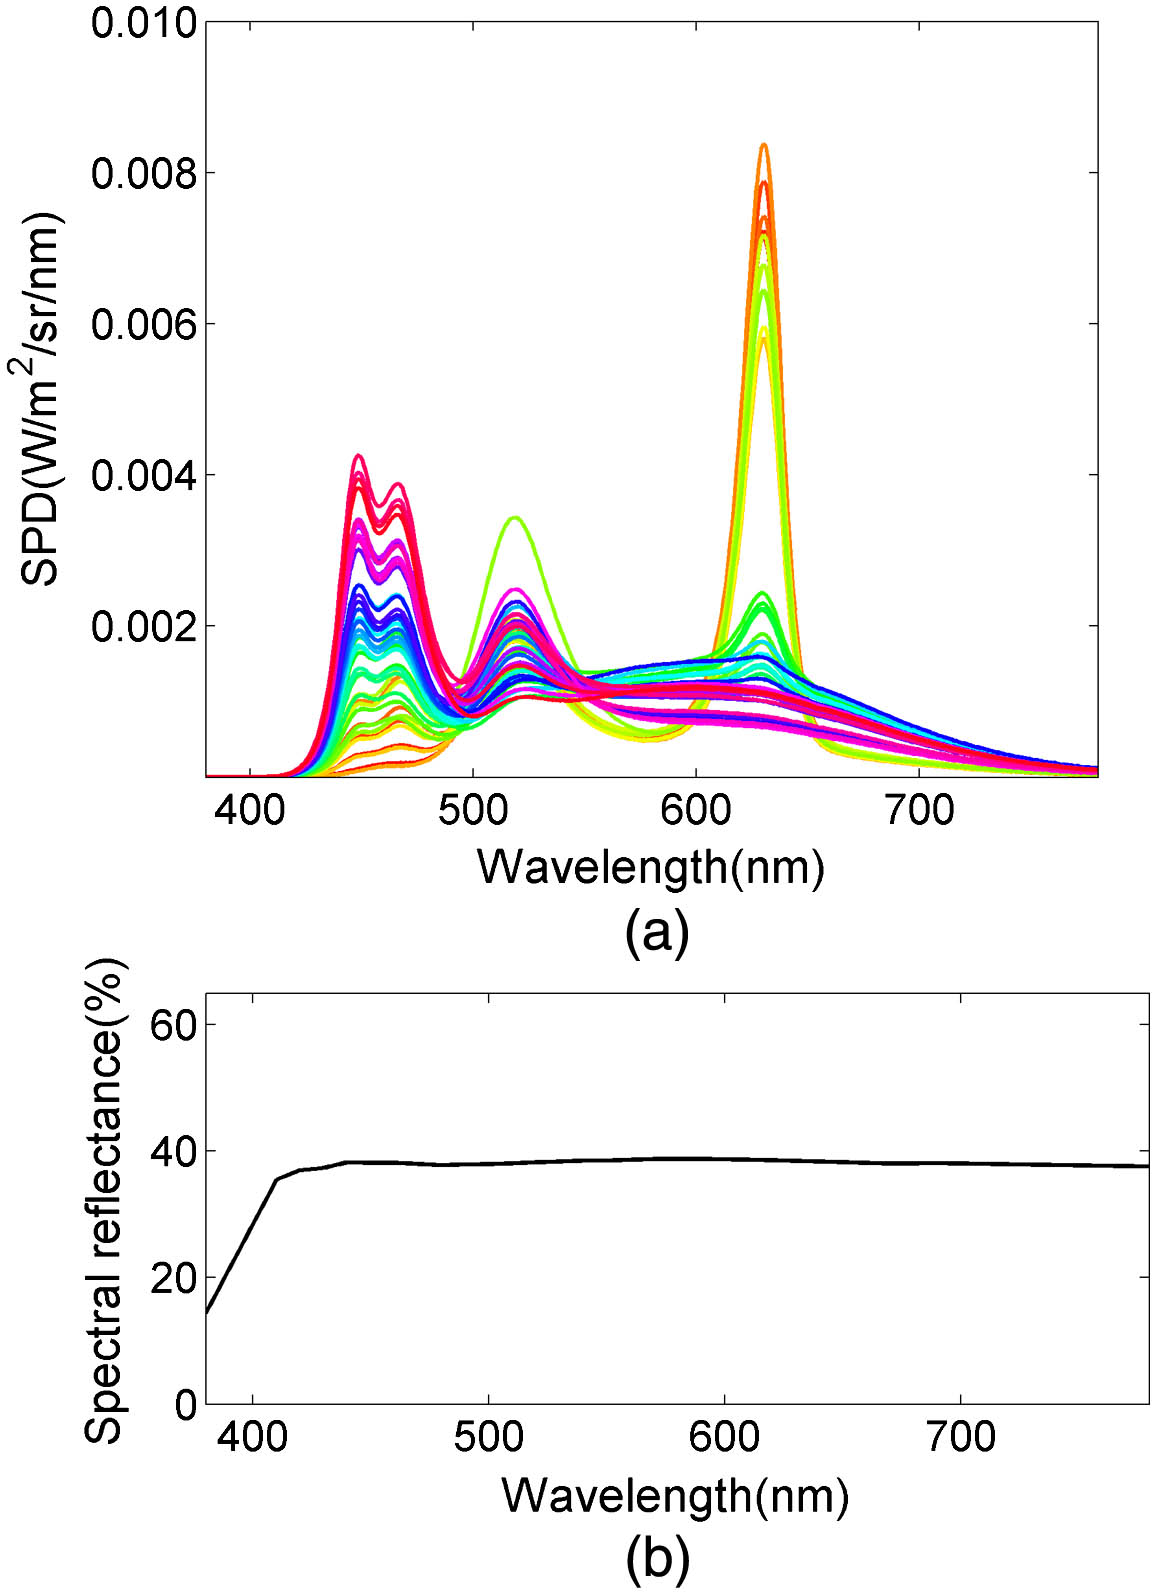
Fig. 1. (a) SPDs of 46 test lighting conditions; (b) spectral reflectance of the interior surface of a light booth.
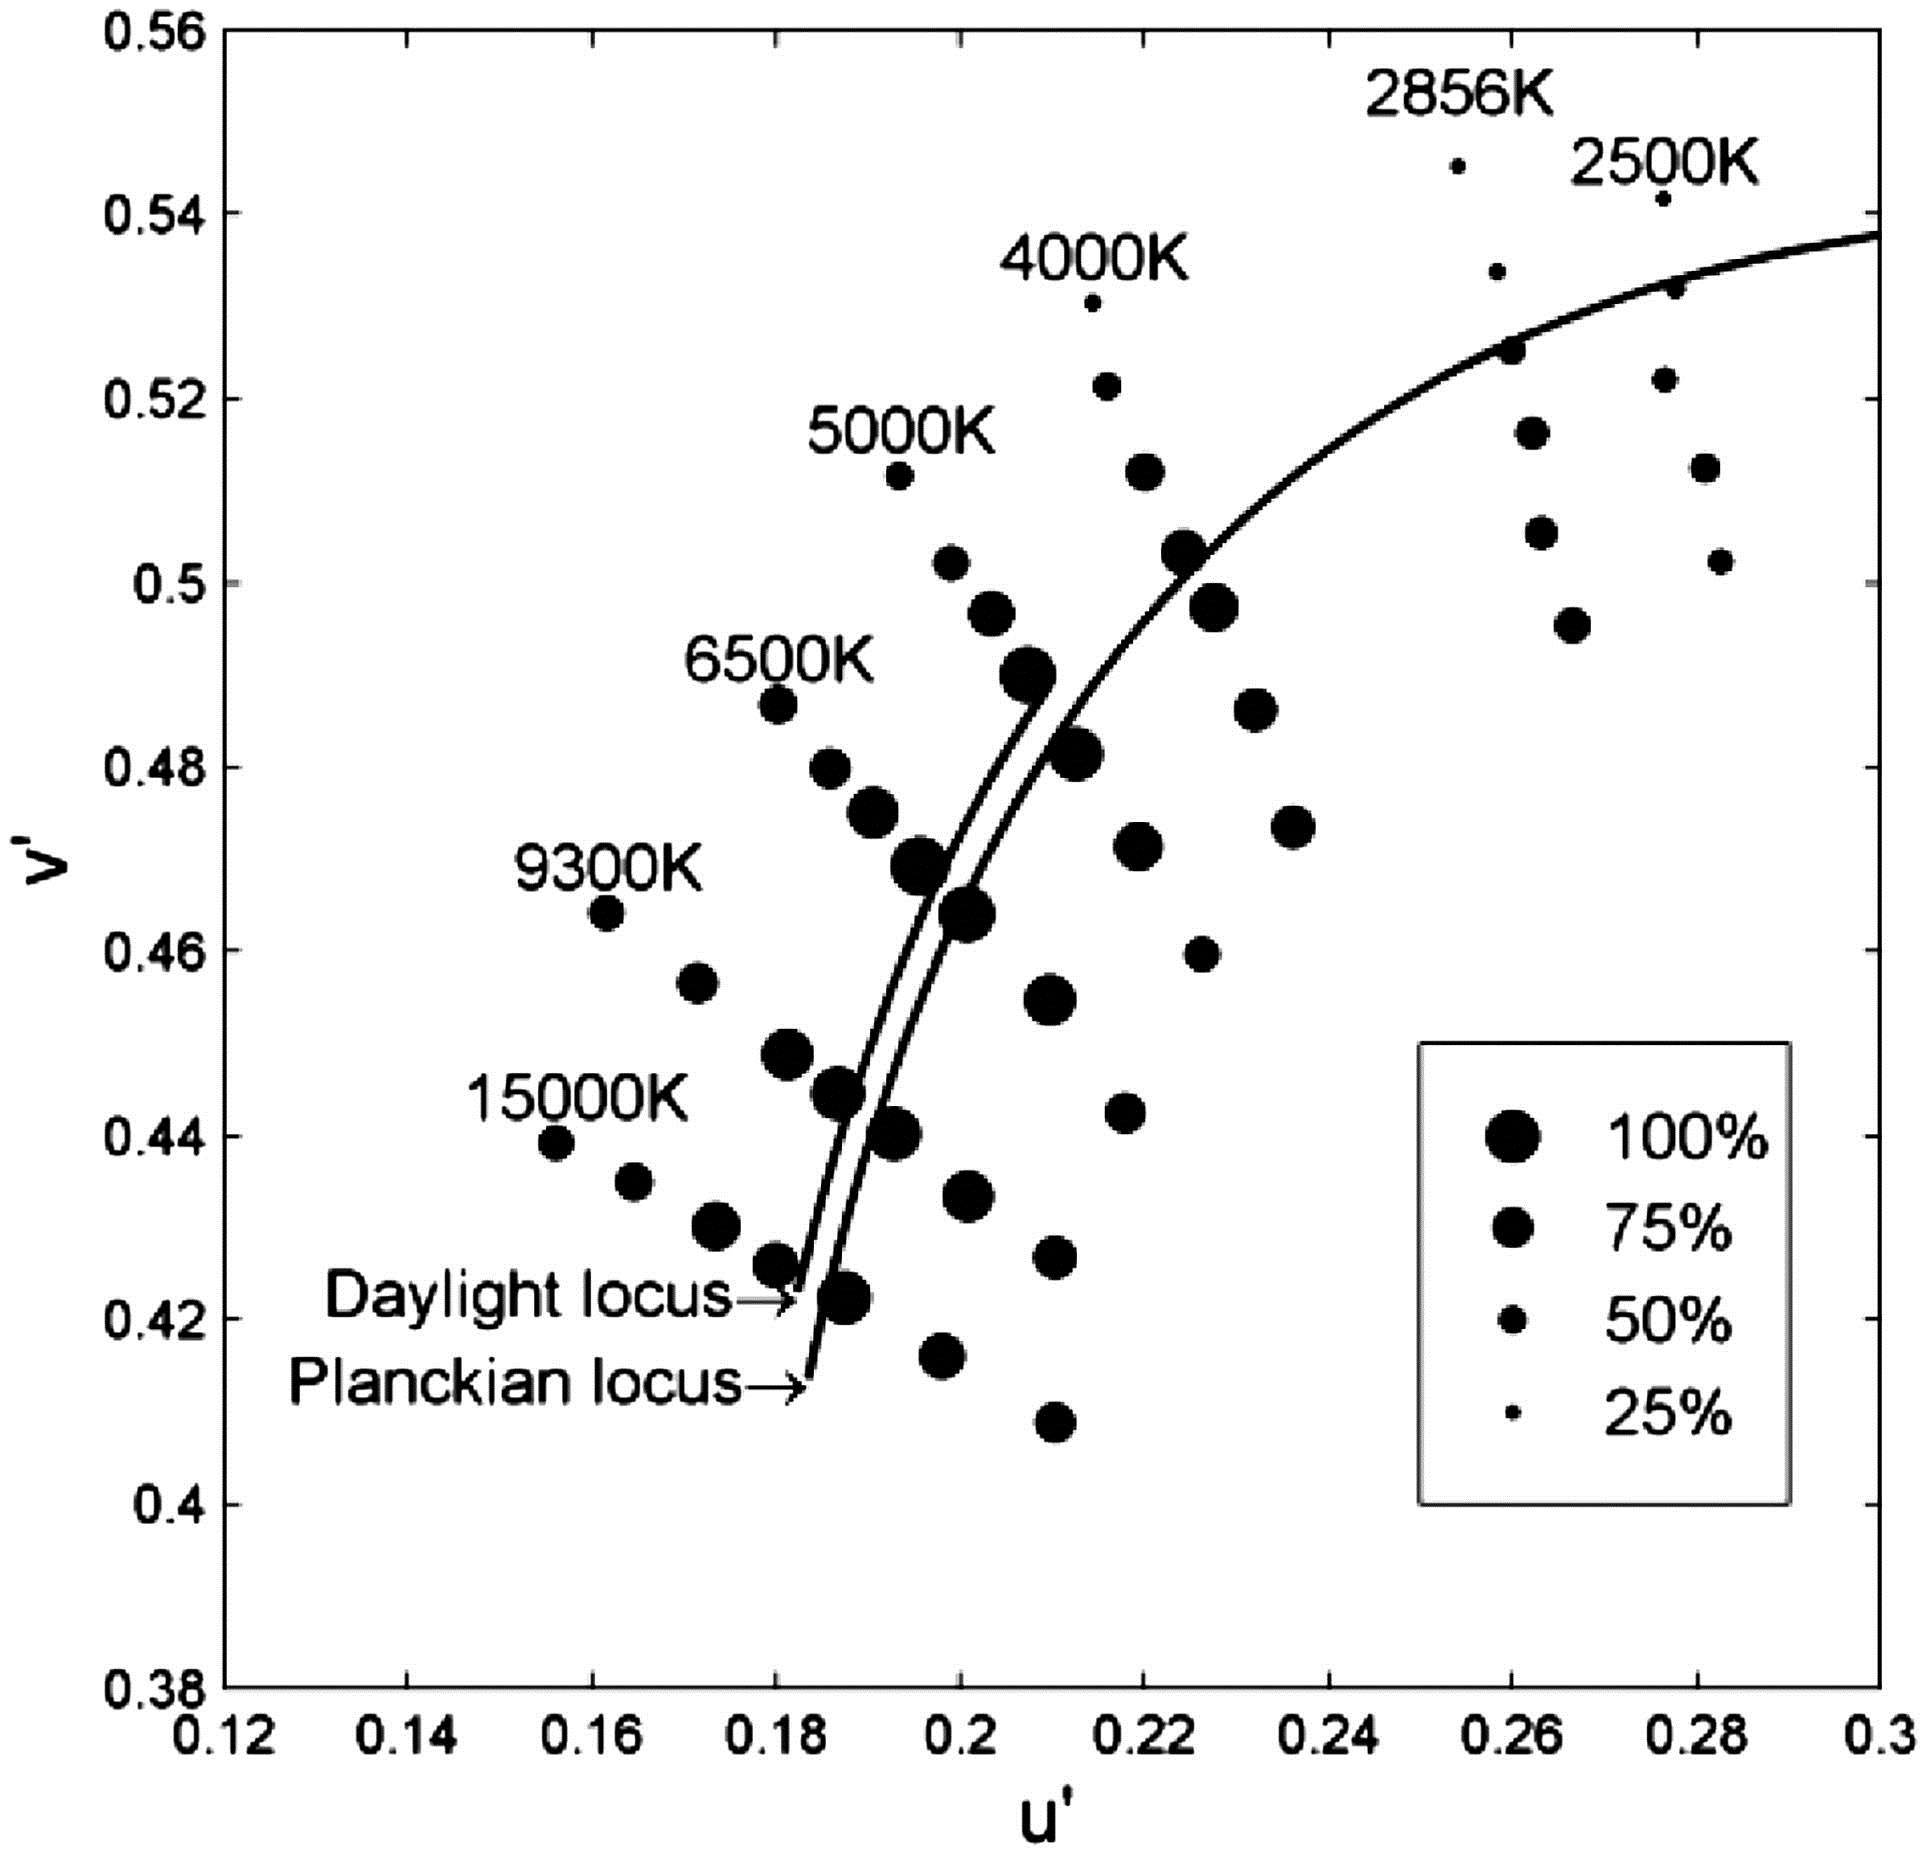
Fig. 2. Bubble charts of the scale values of white estimations for all lighting conditions in CIE1976UCS.
Fig. 3. Correlation of the white sensation estimated from the visual experiment and predicted by the proposed model.
Fig. 4. 3D and 2D demonstration of the white sensation predicted by the model as well as the visual estimations (black dots) of 46 tested stimuli, with the Planckian locus (black line) involved.
Fig. 5. Local extremes of white sensation predicted by our model at seven CCTs with the individual color isotemperature lines and tested chromaticity coordinates in CIE1976UCS.


Set citation alerts for the article
Please enter your email address

© Copyright 2018-2021 | Chinese Laser Press. All Rights Reserved 沪ICP备15018463号-20