In this work, a psychophysical experiment is implemented to assess the white sensation of light-emitting diode (LED) lighting in illuminant mode via a categorical judgment method by a panel of 10 observers. The visual data indicates that the higher values of white sensation estimations locate near the Planckian locus within a correlated color temperature (CCT) range of 5000–9000 K. A model of white sensation for LED lighting in illuminant mode is proposed, from which the predicted maximal white sensation locates near the Planckian locus with a CCT of 6622 K, and the 95% white sensation covers a narrow two-dimensional region.
The concept of white, defined in detail by Hurvich and Jameson in 1951, is applied to describing the properties of light (white light), objects (white objects), and sensation (white sensation)[1]. White light usually refers to a mixed radiation of heterogeneous spectral distributions, or light radiation from Planckian and daylight radiators. In addition, the light sources in practical applications, such as fluorescent and light-emitting diodes (LEDs), are also regarded as radiators that can induce white sensation. Our sensation of white is not directly related to the physical characteristics of a light source but is mainly determined by our visual perception, which may vary with changes of the viewing context and duration. Furthermore, according to the opponent-color theory, white sensation is produced when both chromatic opponent mechanisms, i.e., the red–green response and the yellow–blue response, are at equilibrium if an observer with normal color vision views such an achromatic stimulus[2]. However, in many scientific studies and practical applications, white sensation is often expressed by the colorimetric parameters such as correlated color temperature (CCT), chromaticity coordinates, and so on. The most common method for assessing white is viewing a luminous disc or point source in terms of aperture mode[3]. In aperture mode, the visual stimuli are presented to the observers as real objects[4] or a patch displayed on monitor[5], and so on, which always subtends a small viewing angle of usually less than 10° with a dark[6] or color[7] background. Rea and Freyssinier[8] tested the white sensation of lighting in illuminant mode[9], in which the colors of the volume filled by the source of illumination were assessed, and found a ‘line of white’ for lighting that lay above the Planckian locus for CCT higher than 4000 K and below the locus for lower CCTs. However, although Rea and Freyssinier adopted 42 test lightings involved in six groups of CCTs, they only analyzed and compared the white lightings with the same CCT, so did not seek out the differences of white sensation among different CCTs. In addition, Whitehead[10] showed his suspicion on the result of ‘line of white’ because of their method of data analysis. Thus, in order to precisely measure the visual white sensation for LED lighting in illuminant mode, a psychophysical experiment was implemented in our work with seven groups of CCTs including 46 test lighting conditions. All the visual data were integrally pooled together to derive an empirical model, which could predict the white sensation as a function of the CCT and the distance away from the Planckian locus in CIE1976UCS diagram.
A panel of 10 observers (five males and five females) participated in the visual experiments, all of them were graduate students in Zhejiang University. They have normal color vision, with their ages ranging from 21 to 35 years old so as to avoid age-related influences in vision.
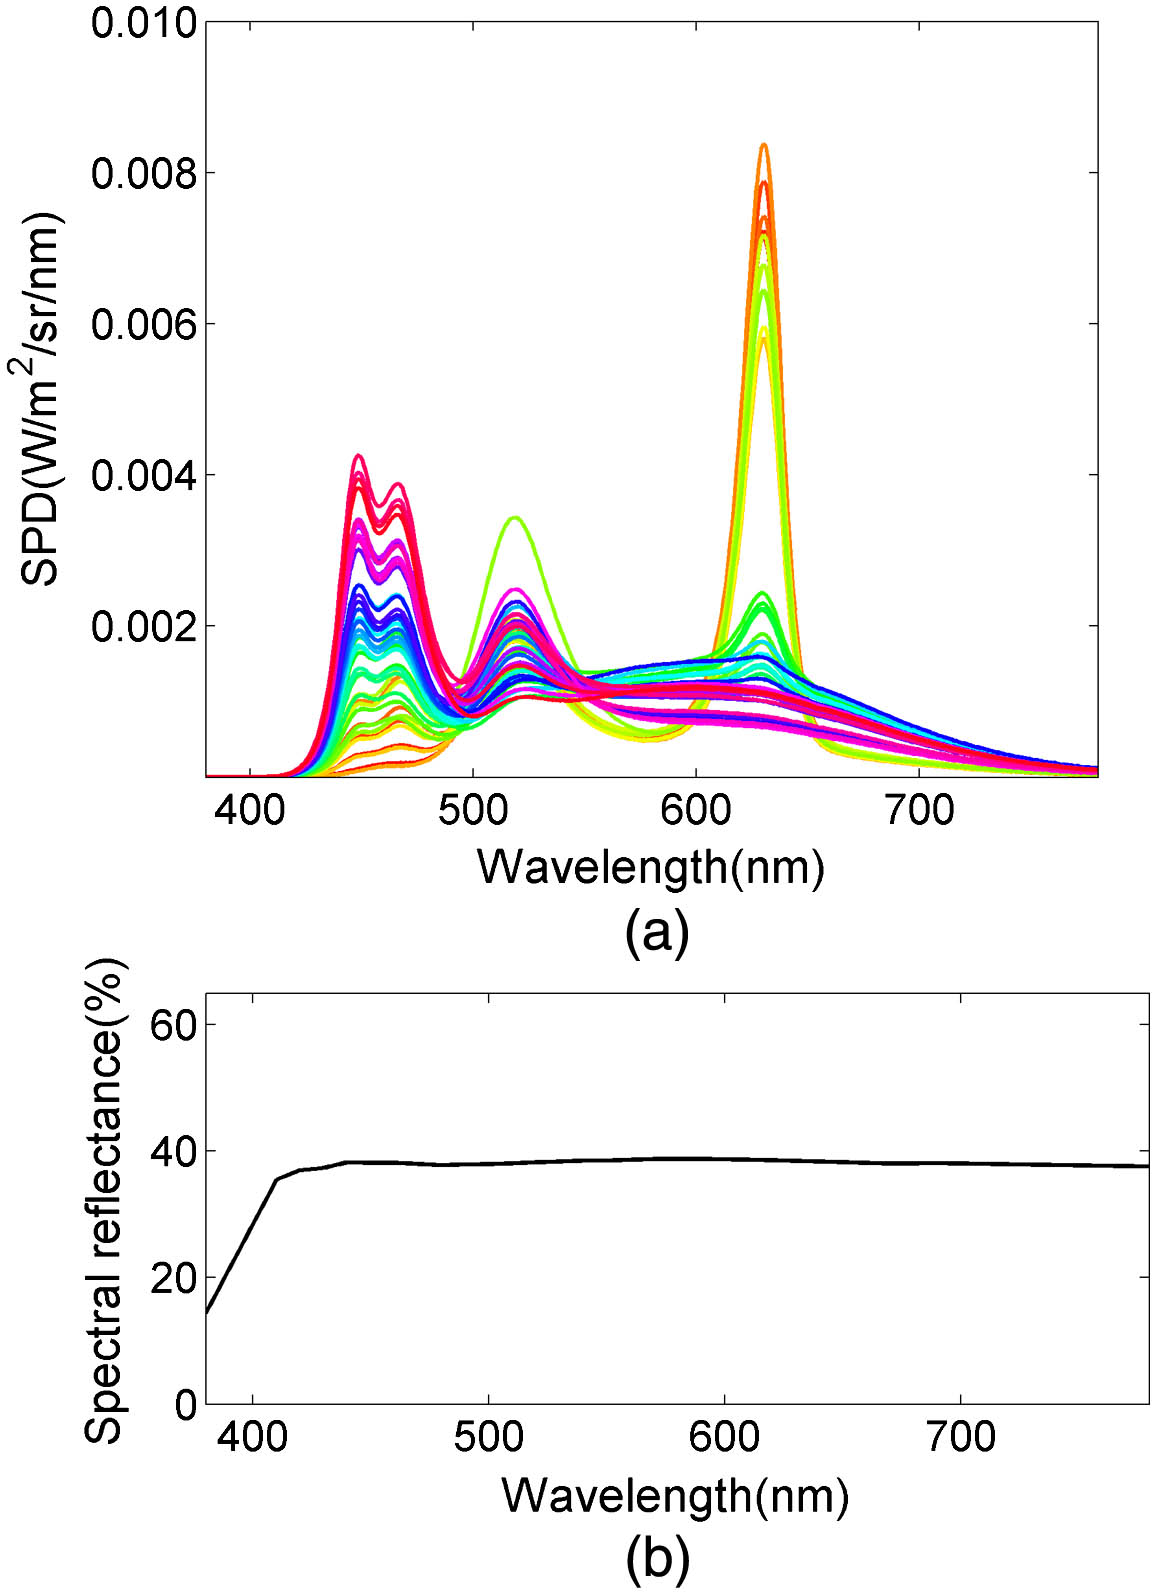
In this study, 46 sets of chromaticity coordinates of lighting conditions were adopted, located at seven color isotemperature lines of, nominally, 2500, 2856, 4000, 5000, 6500, 9300, and 15000 K. The interval of chromaticity coordinates for the test lightings along the individual isotemperature line was about 0.0098 in CIE1976UCS, such that enough of a large gamut was uniformly covered for estimating the white sensation of LED lightings. All experimental setups were actualized by a light booth of Just Normlicht, consisting of six kinds of narrowband LEDs with their wavelength peaks across the visible spectrum (380–780 nm), and the illuminance on the bottom of the light booth was set as 350 lx to reduce, as far as possible, the unfavorable or discomfort fluctuations of perceptual brightness among the assessments for all the 46 test lighting conditions. Their spectral power distributions (SPDs) measured by a tele-spectroradiometer of Model Konica–Minolta CS-2000 are shown in Fig. 1(a).
Sign up for Chinese Optics Letters TOC. Get the latest issue of Chinese Optics Letters delivered right to you!Sign up now
Figure 1.(a) SPDs of 46 test lighting conditions; (b) spectral reflectance of the interior surface of a light booth.
The interior surface of the light booth was painted as the neutral color of Munsell N6, with uniform spectral reflectance as plotted in Fig. 1(b), to provide an achromatic visual stimulus to fill the viewing field during the assessments, and the illuminating and viewing geometry was set at 45/0. Therefore, the reflected light from the interior surface of light booth presented the color of the tested light source. The observers were asked to scale the white sensation of the reflected light from the interior surface by a nine-point numerical category scale, which was used to describe the observers’ perceptual feelings, i.e., 1 = least imaginable, 2 = very little, 3 = mildly, 4 = moderately, 5 = highly, 6 = moderately highly, 7 = mildly highly, 8 = very highly, and 9 = highest imaginable. The 46 lighting conditions were divided into seven groups according to the selected CCT in this work, and these groups were presented randomly to the observers in the experiments. After a 5-min dark adaptation, a brief description about the visual task was declared to the observer before each group. Next, at the beginning of each test lighting condition, 1-min light adaptation was infixed[11–13], and then the observer was asked to estimate the white sensation by rating from 1 to 9. Then, before switching to the next lighting condition, another 1-min dark adaptation was performed, until all the test lighting conditions were completed in this group. Each group would be conducted in about 30 min for one observer. In addition, in order to test the intra-observer variability, five observers were selected to repeat seven lighting conditions chosen from seven groups respectively. In total, 495 assessments were collected from this work [(10 participants × 46 lightings) + (five participants × seven lightings)].
The observer variation can be analyzed by the coefficient of variation (CV), which is a statistical measure to represent the agreement between two data sets[14,15]. The mean CV values calculated from the original categorical scale of the visual estimations are 24 and 14 for inter- and intra-observer variability, respectively, which indicates that the observer variations are acceptable for both self-consistency and reproducibility, implying the credibility of all the experimental data.
The raw data of visual evaluations averaged by the observers via a categorical judgment method are in terms of category scales, which do not contain interval scale meaning. In order for deep analysis on white sensation modeling, these category scales were converted to equal-interval scale values by adopting Case V of Thurstone’s law of comparative judgments[16]. First, the raw data were converted to a frequency matrix denoting the numbers of individual category names, from which a cumulative frequency matrix could be calculated. Second, a cumulative probability matrix was calculated and then transformed to the z-score matrix according to the inverse of the standard normal cumulative distribution. Finally, the ultimate scale values of categorical judgment were computed from the difference matrix and category boundary estimates of the z-score values, and then normalized to 0%–100%. Figure 2 shows bubble charts of the scale values of the white estimations for all lighting conditions, in which the positions of the bubbles are the chromaticity coordinates of the 46 test lightings and their diameters represent the individual normalized scale values of white estimations.
Figure 2.Bubble charts of the scale values of white estimations for all lighting conditions in CIE1976UCS.
As depicted in Fig. 2, the large scale values of white sensation estimations locate near the Planckian locus within the CCT range from 5000 to 9000 K, and the visual data are affected by the combinations of two factors, i.e., the distance away from the Planckian locus in CIE1976UCS and CCT. For the scale values of white sensation estimations on a same color isotemperature line, a similar trend emerges that the scale values are smaller at both ends of the line than those in-between the line, although the local extremes of individual lines would not always be situated near the Planckian locus. As for the influence of CCT, the positions of these local extremes vary with the CCT values, implying that they could be a function of CCT. Furthermore, the scale values of white sensation rise with the increase of CCT until about 6500 K, and then turn to a decrease with the further increase of CCT.
To estimate the white sensations of LED lightings for each CCT group, a distance () in CIE1976UCS from the tested chromaticity coordinates to the Planckian locus was adopted in this work. An integrated model was proposed to predict the white sensation, denoted as WS, ranging from 0% to 100%, with the two independent variables of CCT and , as expressed in where WS is the white sensation, represents the distance from the test chromaticity coordinates to the Planckian locus, and denotes the CCT.
The parameters of this model were derived by pooling all the visual data via the least-squares technique, for which the goodness-of-fit () as well as the standardized residual sum of squares (STRESS)[14] are 0.93 and 8.8, respectively, indicating a satisfactory fitting. Figure 3 illustrates the correlation between the normalized scale values of visual estimation and the predicted white sensations by the model, showing that most data points surround the diagonal line as the ideal consistency between them. The three-dimensional (3D) distribution and two-dimensional (2D) contours of the white sensation predicted by the proposed model as well as the corresponding visual estimations for the 46 tested LED lightings are demonstrated in Fig. 4, in which the black dots (visual estimations) locate near the 3D figure of the model, verifying the accuracy for this model. As shown in Fig. 4, the region with white sensation of 95%, labeled by the minimum red 2D contour on CIE1976- plane, surrounds closely the Planckian locus in the CCT range of 5060–8660 K and the maximal white sensation represented by the blue dot is situated at the chromaticity coordinates of (0.2019, 0.4620) in CIE1976UCS, which is equivalent to a CCT of 6622 K.
Figure 3.Correlation of the white sensation estimated from the visual experiment and predicted by the proposed model.
Figure 4.3D and 2D demonstration of the white sensation predicted by the model as well as the visual estimations (black dots) of 46 tested stimuli, with the Planckian locus (black line) involved.
As mentioned previously, the 95% white sensation region is a 2D area, centered at a CCT of 6622 K, elongating along the Planckian locus. This result seems different from Rea’s conclusion[8] of ‘line of white’ for lighting. However, as noted by Whitehead[10], it is believed that “the substantially white region for light sources has a broad 2D spread” rather than a ‘line of white.’ In addition, most research about white or achromatic sensation indicate that the white region should be a relatively broad or narrow 2D area[3,4,7,17,18]. Nevertheless, Rea’s research has significant practical application in the field of lighting technology for scaling the local extremes of white sensation at the lower CCTs such as 2856 K, since the light sources of low CCTs (warm-white source) are very important luminaires in interior lighting. In view of this, the proposed model can predict not only the maximal white sensation and any specific region of white sensation but also the local extreme of white sensation for any given CCT. Figure 5 plots the local extremes of white points predicted by this model at the 7 CCTs on the tested color isotemperature lines, which indicates a high similarity to the study of Rea and Freyssinier. Therefore, the model proposed in this work has wide applicability for predicting white sensation in the fields of color vision and lighting technology.
Figure 5.Local extremes of white sensation predicted by our model at seven CCTs with the individual color isotemperature lines and tested chromaticity coordinates in CIE1976UCS.
In conclusion, the white sensation in illuminant mode is assessed via psychophysical experiments at an illuminance of 350 lx under 46 sets of chromaticity coordinates of LED lightings. The scale values of white sensation increases with the CCT until reaching about 6500 K, and then decreases with a further increase of the CCT. Moreover, the white sensation is determined by the two factors of CCT and the distance of the tested chromaticity to the Planckian locus. Therefore, for an illuminance level of 350 lx, an empirical model is established to predict the white sensation in illuminant mode. The predicted data by this model indicate that the maximal white sensation is at the chromaticity coordinates of (0.2019, 0.4620) in CIE1976UCS and the 95% white sensation region closely surrounds the Planckian locus at the CCT range of 5060–8660 K. This model may effectively describe the white sensation for the LED interior lighting. Furthermore, the proposed metric also verifies Rea’s ‘line of white’ as one of the outputs from this model, implying its useful properties in practical applications of lighting technology.
References
[1] L. M. Hurvich, D. Jameson. J. Opt. Soc. Am., 41, 521(1951).
[2] L. M. Hurvich, D. Jameson. J. Opt. Soc. Am., 46, 416(1956).
[3] K. Honjyo, M. Nonaka. J. Opt. Soc. Am., 60, 1690(1970).