
Xiaoshi NI, Ziyang LIN, Muyan QIN, Song YE, Deping WANG. Bioactivity and Mechanical Property of PMMA Bone Cement: Effect of Silanized Mesoporous Borosilicate Bioglass Microspheres [J]. Journal of Inorganic Materials, 2023, 38(8): 971
- Journal of Inorganic Materials
- Vol. 38, Issue 8, 971 (2023)
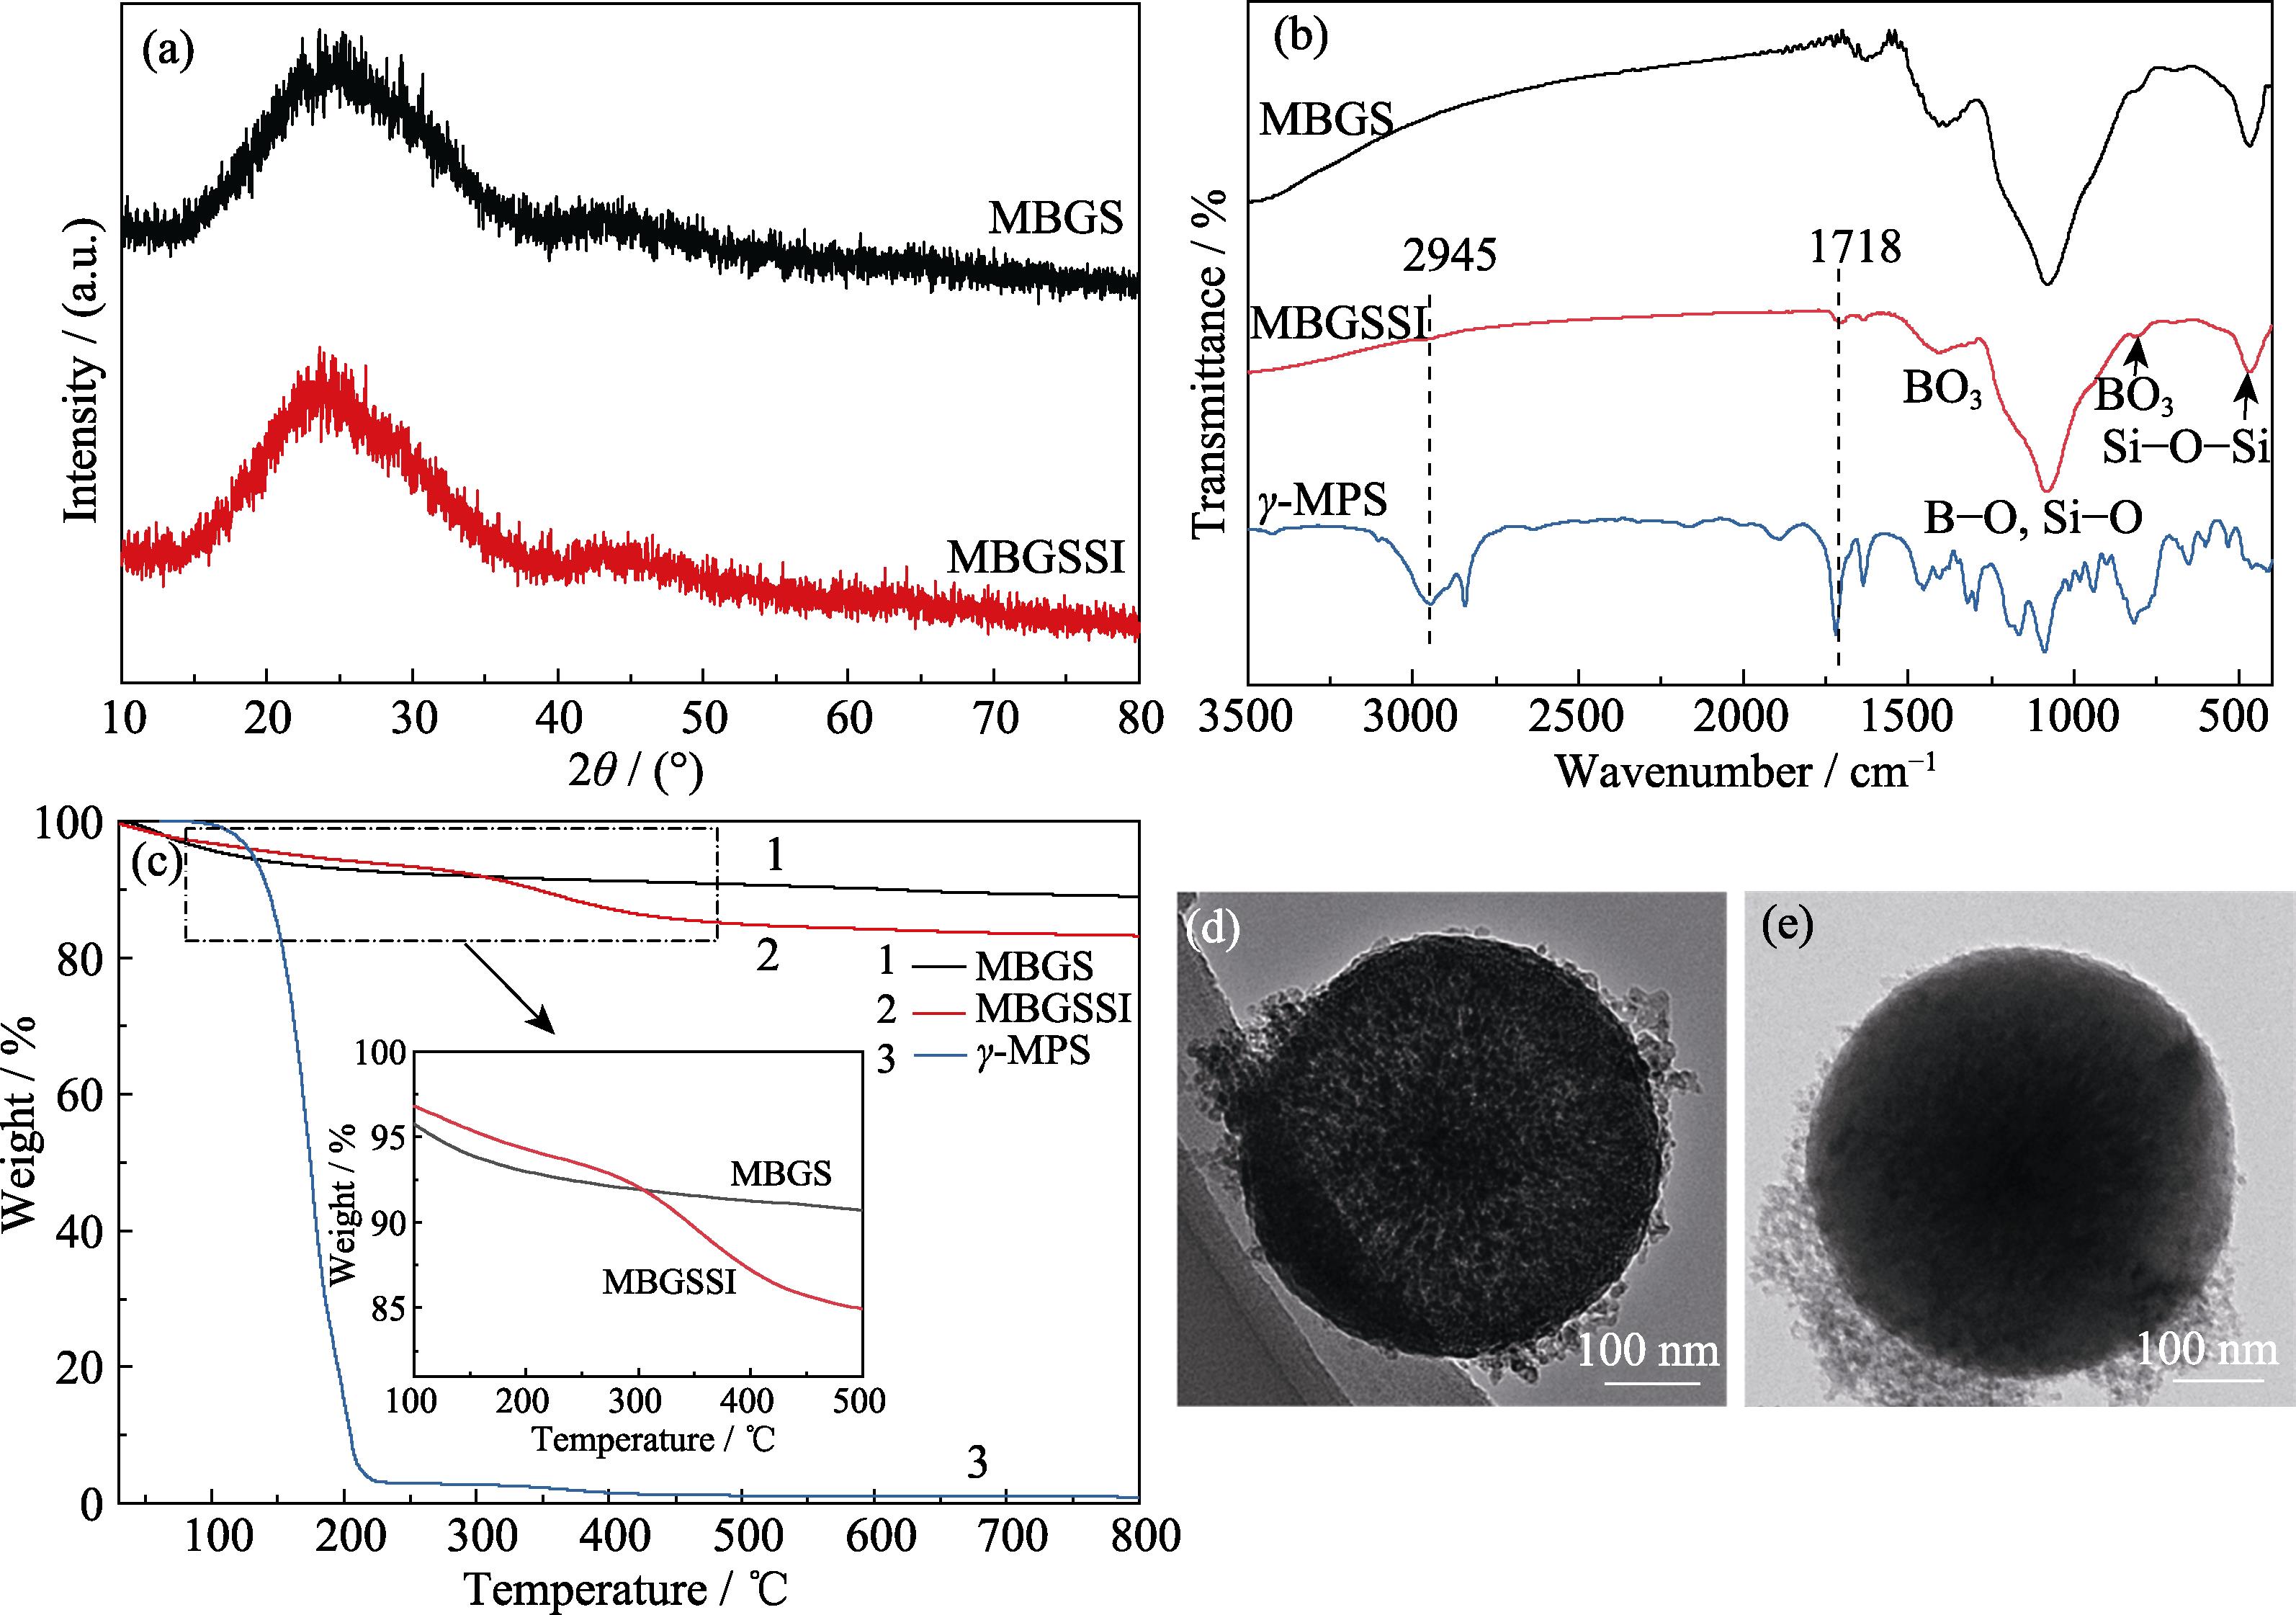
1. Microstructures and constituents of MBGS and MBGSSI(a) XRD patterns of MBGS and MBGSSI; (b, c) FT-IR spectra (b) and TG curves (c) of MBGS, MBGSSI and γ -MPS; (d, e) TEM images of MBGS (d) and MBGSSI (e)
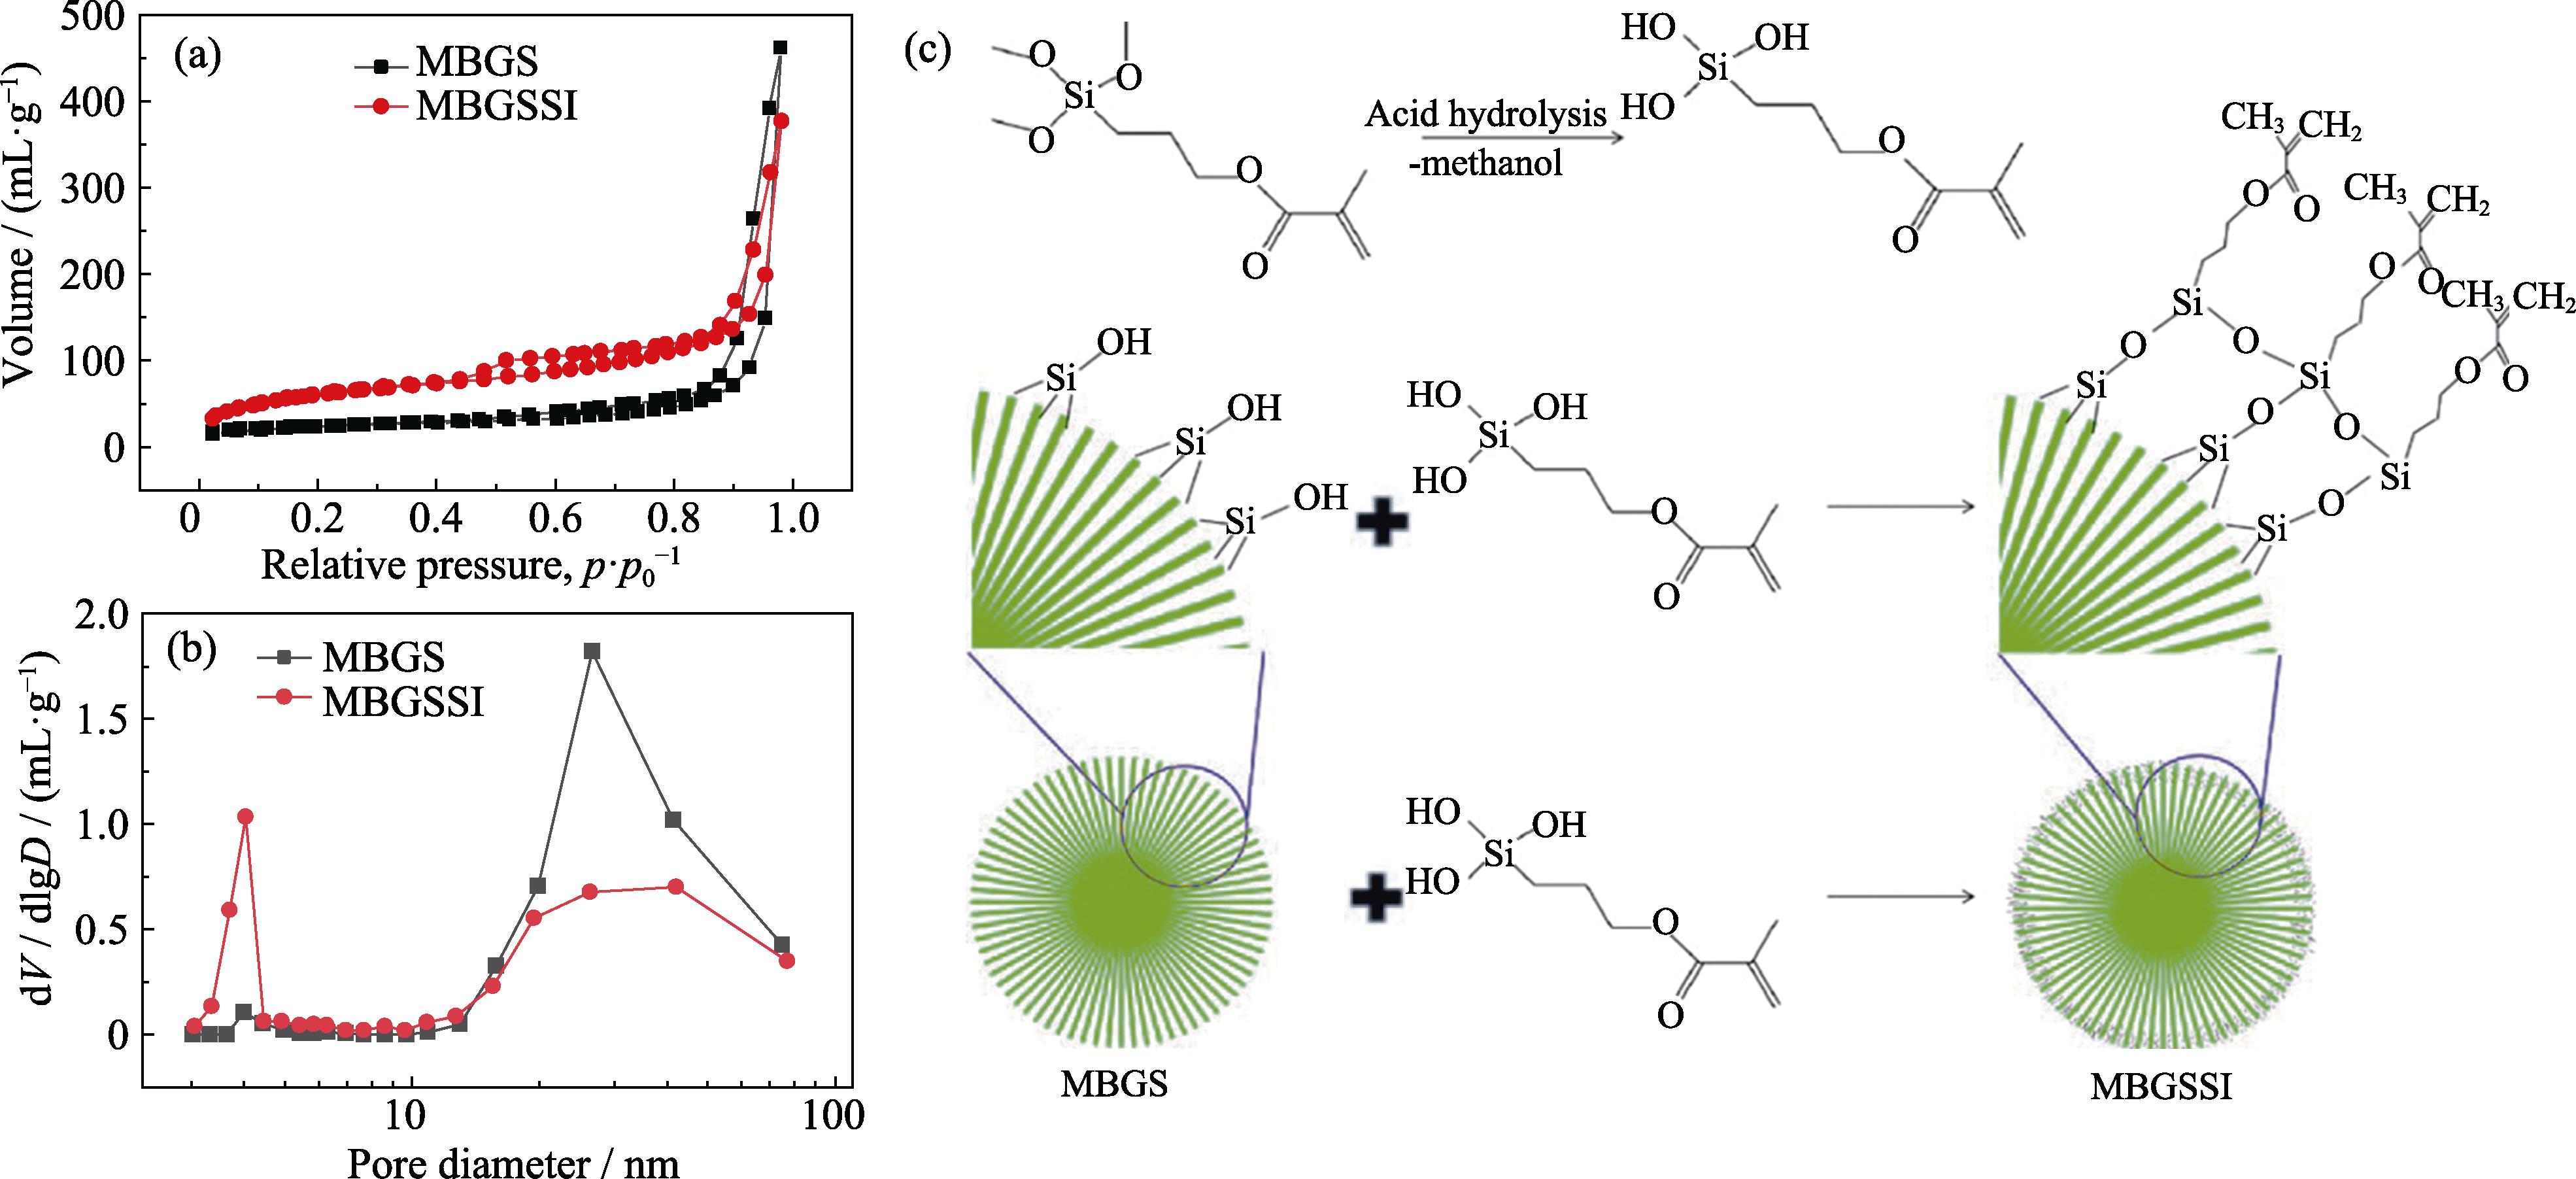
2. (a) N2 adsorption-desorption isotherms and (b) corresponding pore size distributions of MBGS, and (c) schematic diagram of the surface silanization
3. (a) XPS spectra of MBGS and MBGSSI, XPS spectra of C1s in MBGSSI at etching depths of (b) 0 and (c) 100 nm
4. Dispersity of MBGS and MBGSSI in MMA at (a) initial or for (b) 5 min, (c) 1 h, (d) 3 h and (e) 5 h
5. SEM images of (a, b) PMMA, (c, d) MBGS/PMMA and (e, f) MBGSSI/PMMA
6. SEM images and EDS patterns of (a, b) PMMA, (c, d) MBGS/PMMA and (e, f) MBGSSI/PMMA, and (g) XRD patterns of PMMA, MBGS/PMMA, MBGSSI/PMMA
|
Table 1.
Specific surface area, average pore diameter and total pore volume of MBGS and MBGSSI
|
Table 2.
Atomic concentrations of MBGS, MBGSSI and MBGSSI (etching depth at 100 nm)
|
Table 3.
Setting and mechanical properties of PMMA, MBGS/PMMA and MBGSSI/PMMA bone cements

Set citation alerts for the article
Please enter your email address
© Copyright 2018-2021 | Chinese Laser Press. All Rights Reserved 沪ICP备15018463号-20