• Journal of Geographical Sciences
  • Vol. 30, Issue 7, 1083 (2020)
Fan YANG1、2, Fanneng HE1、*, Meijiao LI1、2, and Shicheng LI3
Author Affiliations
  • 1Key Laboratory of Land Surface Pattern and Simulation, Institute of Geographic Sciences and Natural Resources Research, CAS, Beijing 100101, China
  • 2University of Chinese Academy of Sciences, Beijing 100049, China
  • 3School of Public Administration, China University of Geosciences, Wuhan 430074, China
  • show less
    DOI: 10.1007/s11442-020-1771-2 Cite this Article
    Fan YANG, Fanneng HE, Meijiao LI, Shicheng LI. Evaluating the reliability of global historical land use scenarios for forest data in China[J]. Journal of Geographical Sciences, 2020, 30(7): 1083 Copy Citation Text show less
    Forested areas of China since 1700 according to the SAGE, PJ, KK10, and CHFD datasets
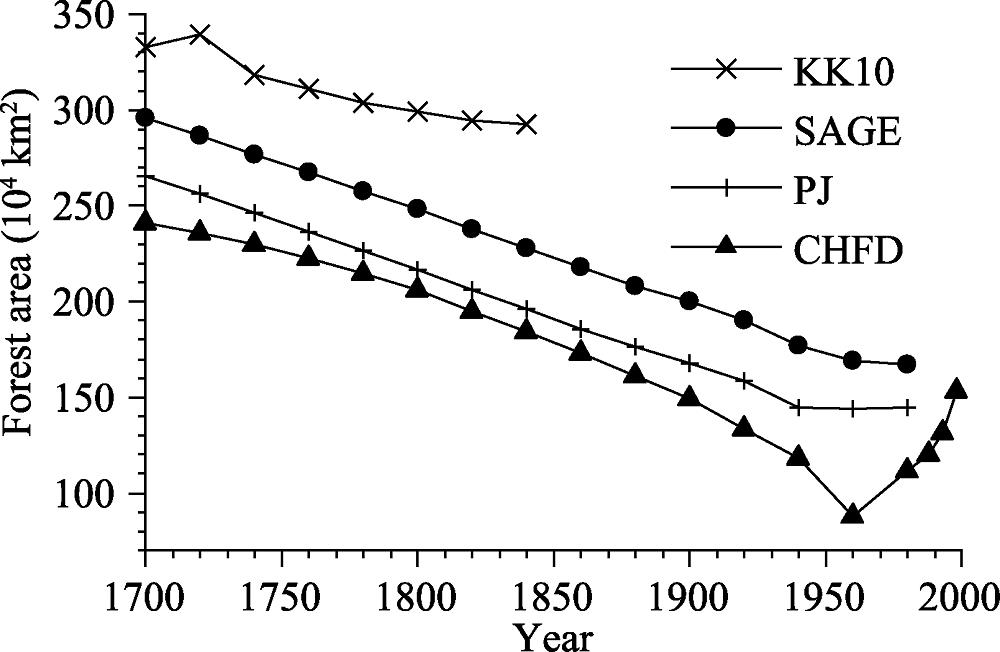
    Fig. 1. Forested areas of China since 1700 according to the SAGE, PJ, KK10, and CHFD datasets
    Provincial forested area of China for 1700-1990 from the PJ and CHFD datasets
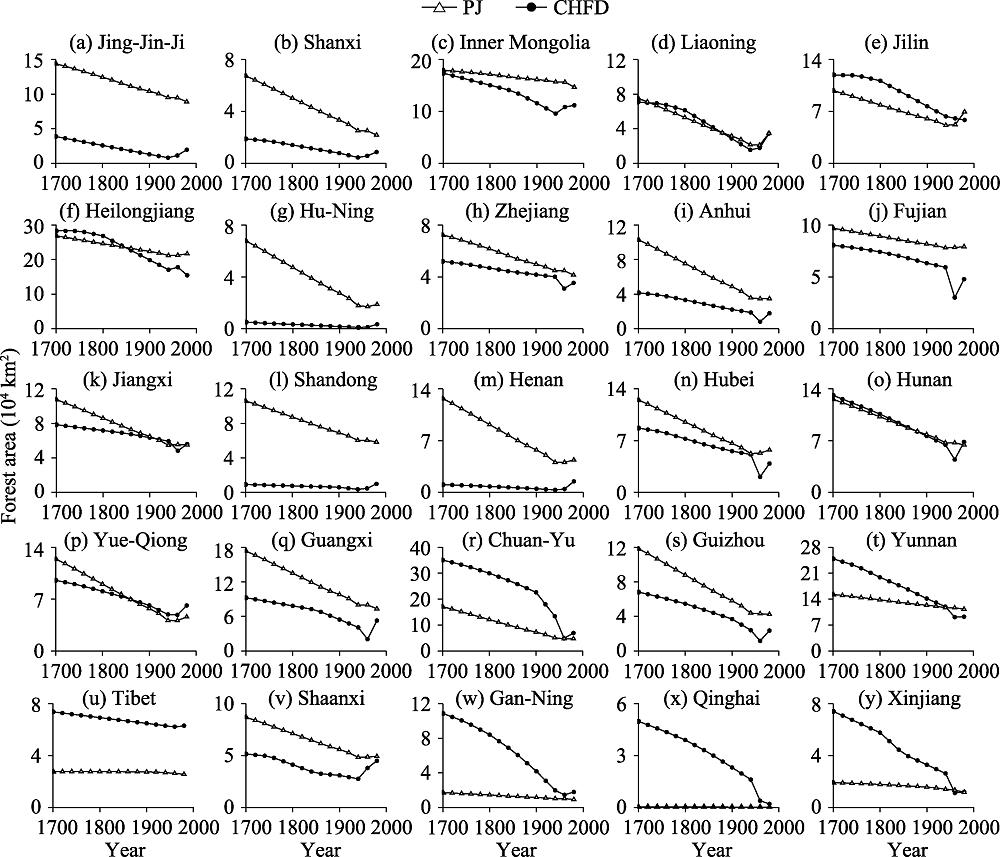
    Fig. 2. Provincial forested area of China for 1700-1990 from the PJ and CHFD datasets
    The spatial patterns of distribution of forests, and relative biases between the PJ and CHFD datasets
    Fig. 3. The spatial patterns of distribution of forests, and relative biases between the PJ and CHFD datasets
    DatasetsThematic coverageTemporal coverageTemporal resolutionSpatial resolution
    SAGECropland, natural vegetation (forest, grassland)1700-19921-50 a0.5°×0.5°
    PJAgricultural area (cropland, pasture), natural vegetation (forest, grassland, shrub, and tundra)800-19921 a0.5°×0.5°
    KK10Anthropogenic deforestation8000-18501 a5°×5°
    CHFDForest1700-20005-50 a10 km×10 km
    Table 1.

    Details of the SAGE, PJ, KK10, and CHFD datasets

    YearsCHFDForest area(104 km2)SAGEPJKK10
    Forest area(104 km2)Relative bias (%)Forest area(104 km2)Relative bias (%)Forest area(104 km2)Relative bias (%)
    1700241.27296.0020.44265.239.47333.0432.23
    1720235.58286.4019.53256.308.43339.6336.58
    1740229.89276.8018.57246.376.92318.0432.46
    1760222.81267.2018.17236.415.92311.2033.41
    1780214.34257.6018.38226.415.48303.6534.83
    1800205.87248.0018.62216.354.97299.1037.35
    1820194.99238.0019.93206.225.60294.5541.25
    1840184.11228.0021.38195.916.21292.5046.29
    1860172.74218.0023.27185.667.21
    1880160.88208.0025.69176.219.10
    1900149.02200.0029.42167.8011.87
    1920133.48190.0035.31158.2016.99
    1940117.94177.0040.60144.4420.27
    196087.88169.0065.39143.9849.37
    1980111.92167.0040.02144.8625.80
    Table 2.

    Forest area of China and relative biases among the SAGE, PJ, KK10, and CHFD datasets

    Relative biases (%)17201780184019001960
    <109.327.596.474.813.05
    10-3017.1414.5111.739.477.18
    30-507.979.709.858.055.04
    50-705.716.396.247.144.81
    70-904.664.814.744.214.66
    >9055.1956.9960.9866.3275.27
    Table 3.

    The percentage of grid cells of different relative biases between the PJ and CHFD datasets

    Fan YANG, Fanneng HE, Meijiao LI, Shicheng LI. Evaluating the reliability of global historical land use scenarios for forest data in China[J]. Journal of Geographical Sciences, 2020, 30(7): 1083
    Download Citation