
Jialin Sun, zhiqiang Liu, Mao Ye. Extended Depth of Field Imaging Using Liquid Crystal Lenses[J]. Acta Optica Sinica, 2023, 43(10): 1011003
- Acta Optica Sinica
- Vol. 43, Issue 10, 1011003 (2023)
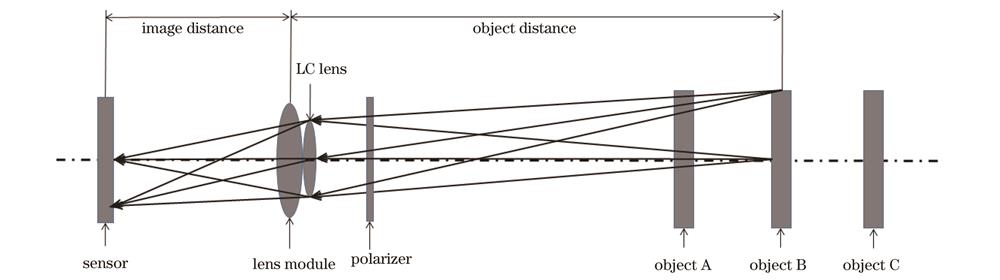
Fig. 1. Optical imaging system with the liquid crystal lens

Fig. 2. Focus position of system and corresponding depth of field during the switching of liquid crystal lenses
Fig. 3. Image selection
Fig. 4. Structure of the LC lens
Fig. 5. Test path of liquid crystal lenses (Mach-Zehnder interferometer)
Fig. 6. Voltage scanning of the LC lens. (a) Fixed V2 at 100 V and V1 scanned from 5 V to 100 V in 5 V steps; (b) fixed V1
Fig. 7. Power and RMS aberration change with time during switching. (a) Relationship between power and time; (b) relationship between RMS aberration and time
Fig. 8. Fused images using complex-valued wavelets. (a) Focus on the background; (b) focus on the doll; (c) focus on the flowers; (d) fusion of multi-focus images Fig. 8(a)-(c); (e) focus on the background; (f) focus on the leaves; (g) focus on the flowers; (h) fusion of multi-focused images Fig. 8(e)-(g)
Fig. 9. Change of object distance and depth of field with power and time during the switching of liquid crystal lens. (a) Change of object distance
Fig. 10. Frames focus on each object. (a) Focus on the ①; (b) focus on the ②; (c) focus on the ③; (d) focus on the ④
Fig. 11. Extended depth of field images. (a) Fusion of all images, S1; (b) fusion of selected images, S2
Fig. 12. Comparison of the same ROI for different images. (a) Background in the source image; (b) background in S1; (c) background in S2; (d) horse in the source image; (e) horse in S1; (f) horse in S2; (g) intermediate doll in the source image; (h) intermediate doll in S1; (i) intermediate doll in S2; (j) left doll in the source image; (k) left doll in S1; (l) left doll in S2
Fig. 13. Relationship between calculation time and number of images
|
Table 1. AG of ROI of source image, S1, and S2
|
Table 2. AG difference of ROI between source image and S1, S1 and S2

Set citation alerts for the article
Please enter your email address
© Copyright 2018-2021 | Chinese Laser Press. All Rights Reserved 沪ICP备15018463号-20