• Infrared and Laser Engineering
  • Vol. 50, Issue 6, 20211030 (2021)
Tingwei Cui1、2、3, Tingxuan Huang4、5, Bing Mu4, Fei Gao6, Yanfang Xiao5, Rongjie Liu5, Yi Ma5, and Jie Zhang5
Author Affiliations
  • 1School of Atmospheric Sciences, Sun Yat-Sen University, Zhuhai 519082, China
  • 2Key Laboratory of Tropical Atmosphere-Ocean System, Ministry of Education, Zhuhai 519082, China
  • 3Southern Marine Science and Engineering Guangdong Laboratory, Zhuhai 519082, China
  • 4College of Information Science and Engineering, Ocean University of China, Qingdao 266071, China
  • 5First Institute of Oceanography, Ministry of Natural Resources, Qingdao 266061, China
  • 6National Ocean Technology Center, Tianjin 300112, China
  • show less
    DOI: 10.3788/IRLA20211030 Cite this Article
    Tingwei Cui, Tingxuan Huang, Bing Mu, Fei Gao, Yanfang Xiao, Rongjie Liu, Yi Ma, Jie Zhang. Spatiotemporal pattern of aerosol types over the Bohai and Yellow Seas observed by CALIOP[J]. Infrared and Laser Engineering, 2021, 50(6): 20211030 Copy Citation Text show less
    (a) Schematic diagram of the study area and (b) CALIOP tracks (The yellow and green lines are day and night tracks, respectively)
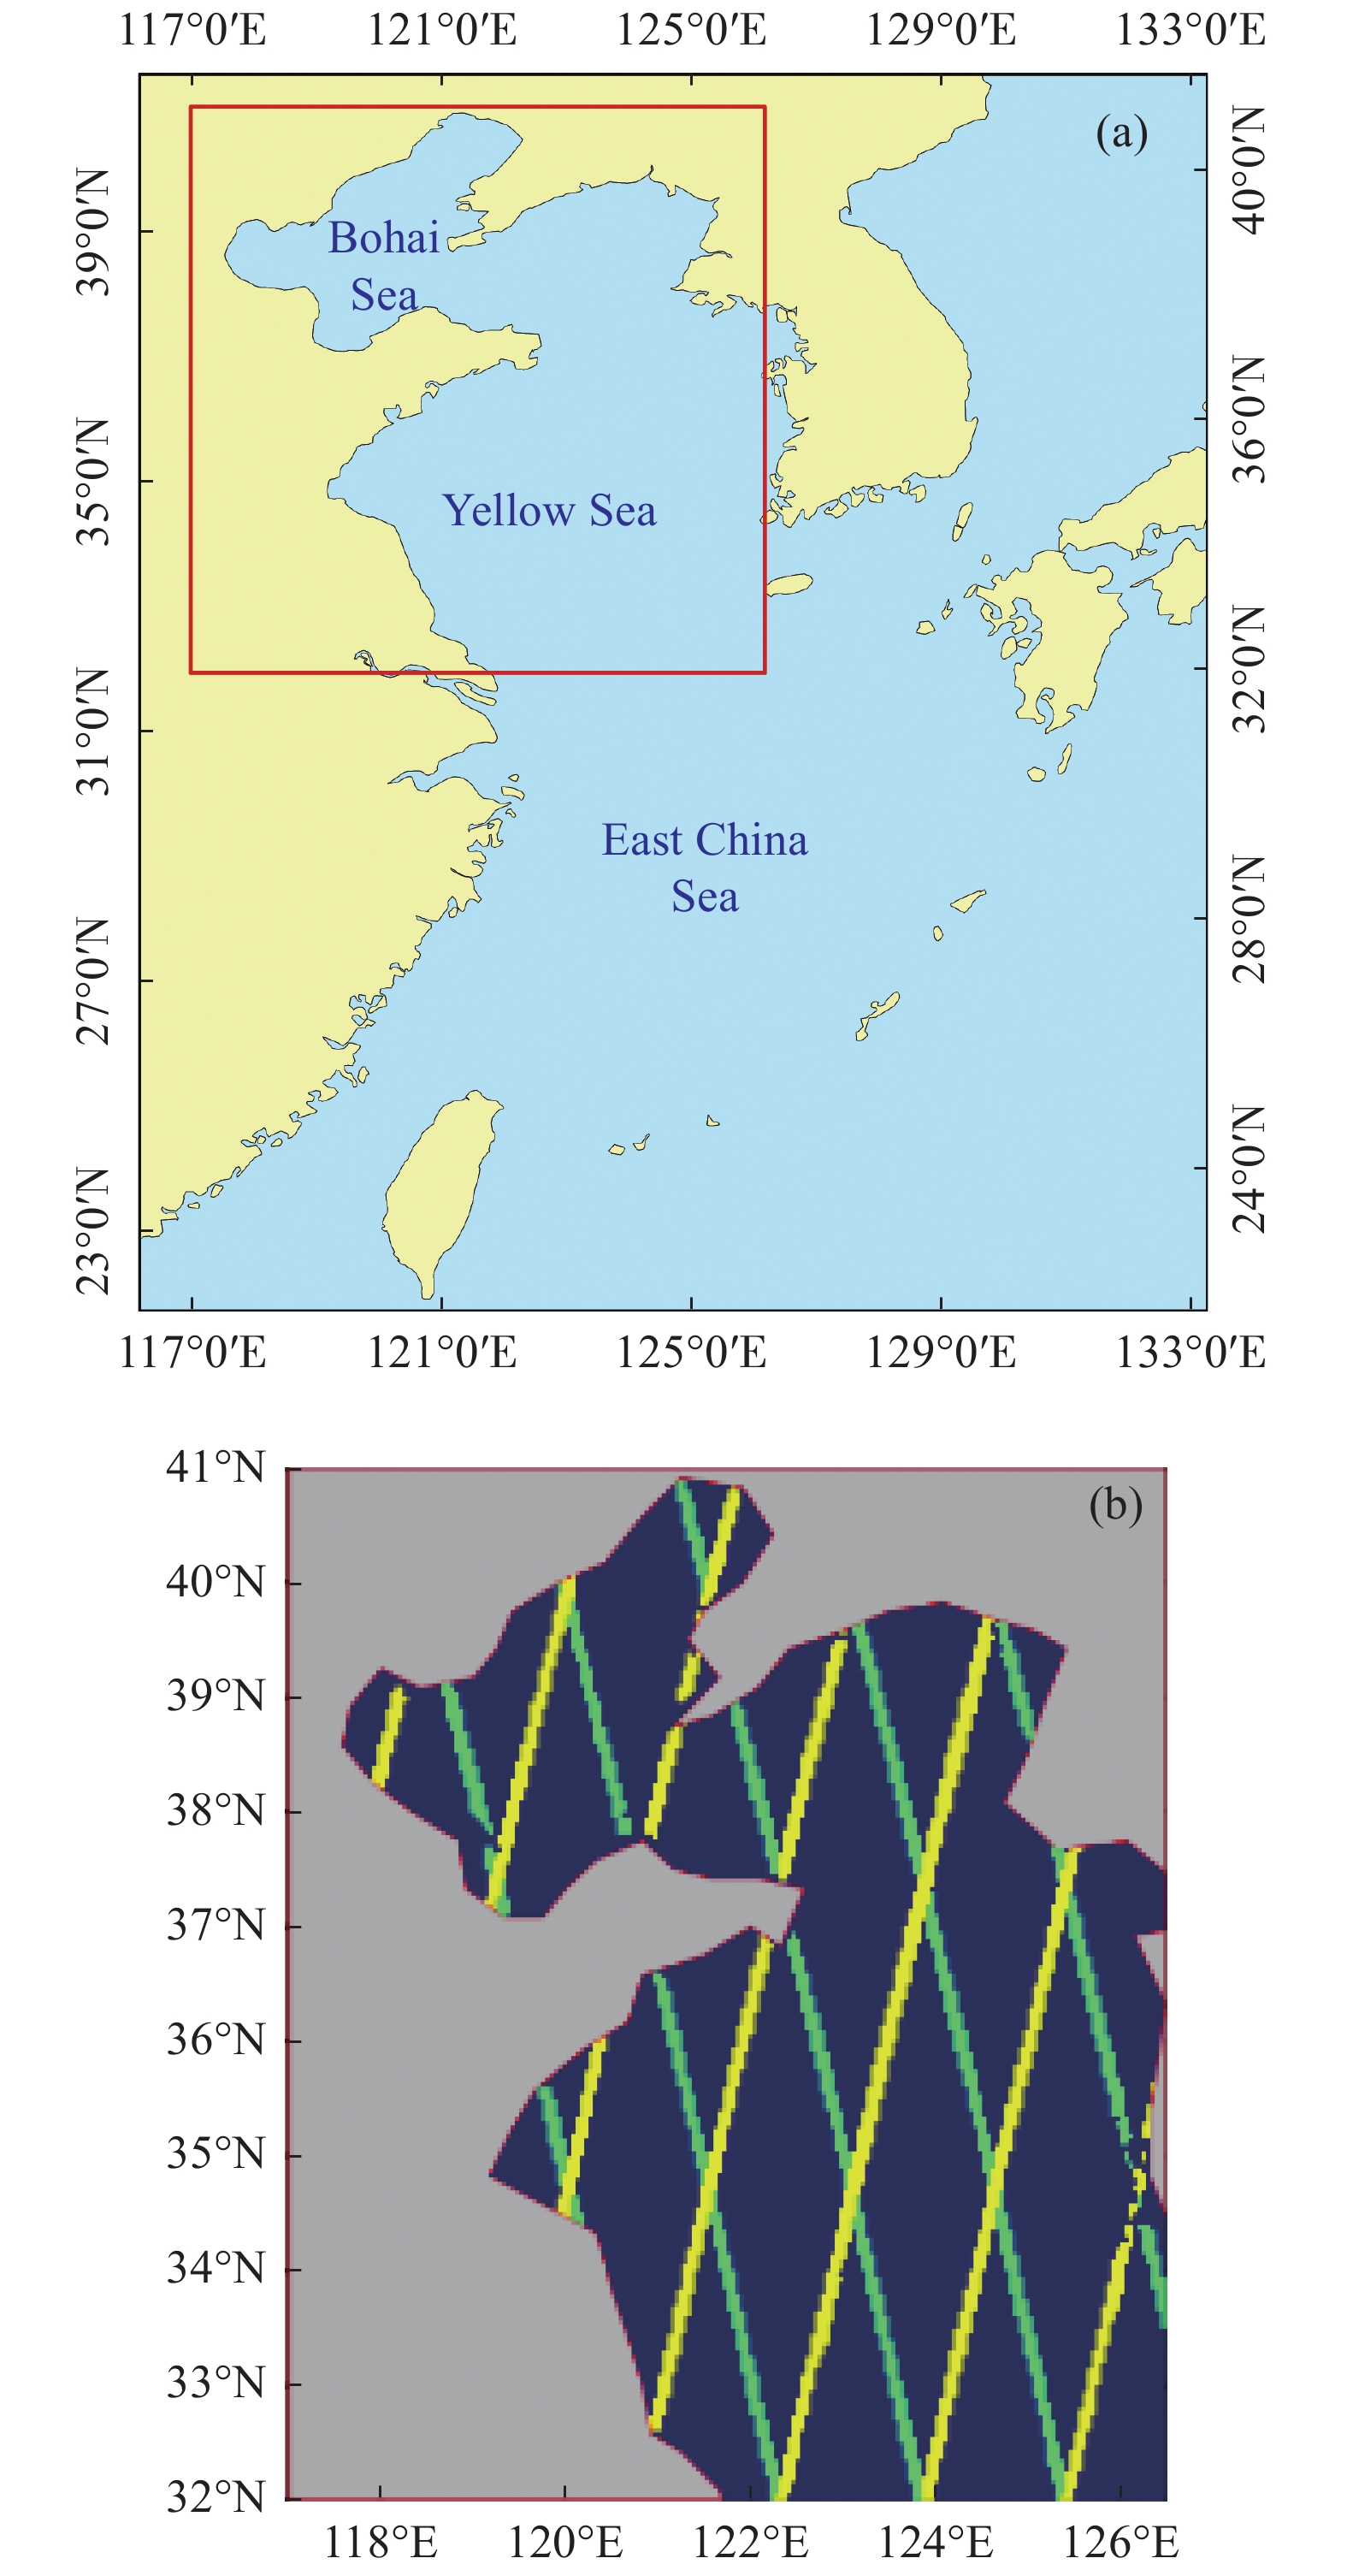
    Fig. 1. (a) Schematic diagram of the study area and (b) CALIOP tracks (The yellow and green lines are day and night tracks, respectively)
    Percentage of various types of aerosols (2006-2019)
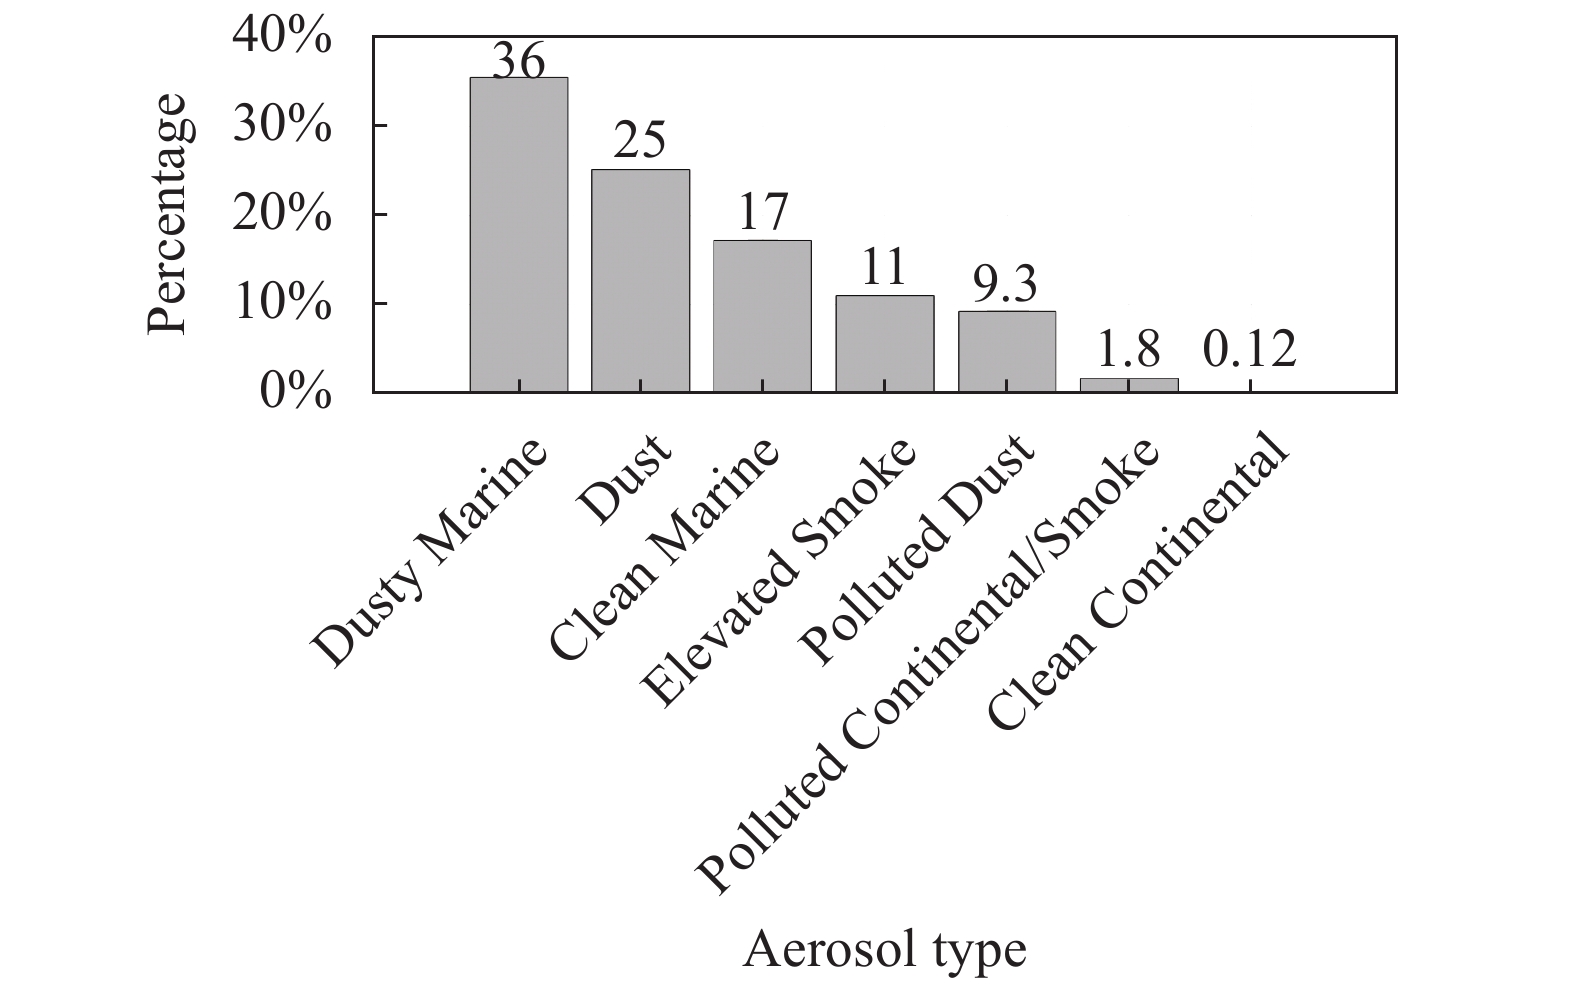
    Fig. 2. Percentage of various types of aerosols (2006-2019)
    Percentage of various types of aerosols in different seasons
    Fig. 3. Percentage of various types of aerosols in different seasons
    Vertical distribution of percentages of the 5 dominant aerosol types
    Fig. 4. Vertical distribution of percentages of the 5 dominant aerosol types
    Dominant aerosol types (0=Not Determined; 1=Clean Marine; 2=Dust; 3=Polluted Continental/Smoke; 4=Clean Continental; 5=Polluted Dust; 6=Elevated Smoke; 7=Dusty Marine)
    Fig. 5. Dominant aerosol types (0=Not Determined; 1=Clean Marine; 2=Dust; 3=Polluted Continental/Smoke; 4=Clean Continental; 5=Polluted Dust; 6=Elevated Smoke; 7=Dusty Marine)
    Bayesian trend analysis (red lines) of the percentages (black lines) of different types of aerosols from 2006 to 2019
    Fig. 6. Bayesian trend analysis (red lines) of the percentages (black lines) of different types of aerosols from 2006 to 2019
    Tingwei Cui, Tingxuan Huang, Bing Mu, Fei Gao, Yanfang Xiao, Rongjie Liu, Yi Ma, Jie Zhang. Spatiotemporal pattern of aerosol types over the Bohai and Yellow Seas observed by CALIOP[J]. Infrared and Laser Engineering, 2021, 50(6): 20211030
    Download Citation