
Ya PENG, Dong-ling LI, Wei-hao WAN, Qing-qing ZHOU, Wen-yi CAI, Fu-lin LI, Qing-bin LIU, Hai-zhou WANG. Analysis of Composition Distribution of New Cast-Forging FGH4096 Alloy Turbine Disk Based on Microbeam X-Ray Fluorescence Spectroscopy[J]. Spectroscopy and Spectral Analysis, 2021, 41(11): 3498
- Spectroscopy and Spectral Analysis
- Vol. 41, Issue 11, 3498 (2021)
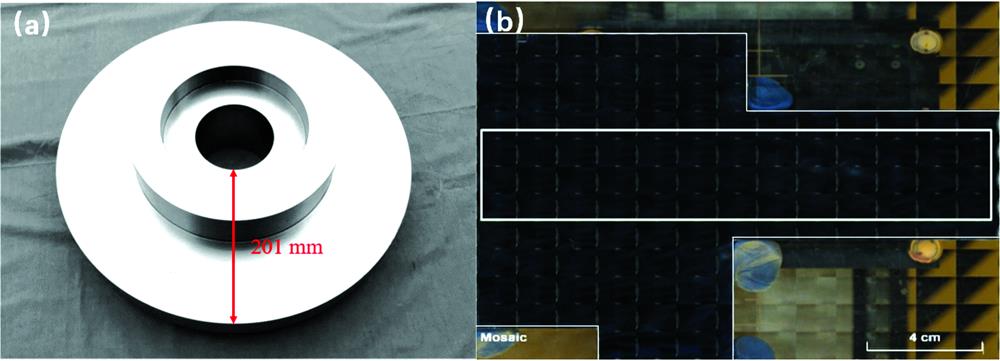
Fig. 1. Morphology of turbine disk
(a): Intact turbine disk; (b): Turbine disk slicing and measuring area
(a): Intact turbine disk; (b): Turbine disk slicing and measuring area
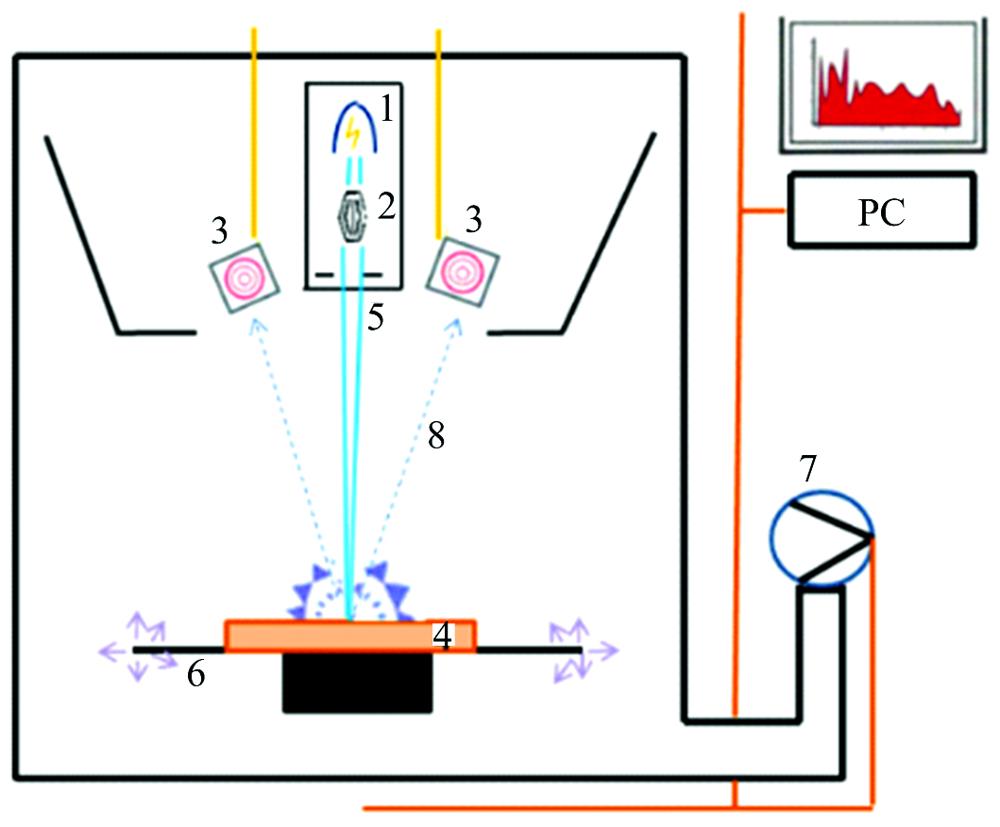
Fig. 2. Schematic overview of the M4 Tornado μ-XRF spectrometer
1: The Rh X-Ray source; 2: Poly-capillary optics; 3: Silicon Drift Detectors; 4: The sample; 5: Focused incident X-Ray beam; 6: Sample stage; 7: Vacuum pump; 8: The outgoing fluorescence
1: The Rh X-Ray source; 2: Poly-capillary optics; 3: Silicon Drift Detectors; 4: The sample; 5: Focused incident X-Ray beam; 6: Sample stage; 7: Vacuum pump; 8: The outgoing fluorescence
Fig. 3. Peak-to-back ratio under different measured voltages and currents of X-ray tubes
Fig. 4. X-ray fluorescence spectrum of large-size casting-forging GH4096 after side scanning
Fig. 5. Two-dimensional distribution map of the percentage content of each element in turbine disk
(a): Cr; (b): Co; (c): Mo; (d): Ti; (e): Ni; (f): W; (g): Nb; (h): Al
(a): Cr; (b): Co; (c): Mo; (d): Ti; (e): Ni; (f): W; (g): Nb; (h): Al
Fig. 6. Histogram of frequency distribution of different percentages of major elements in turbine disk
Fig. 7. Content variation diagram of three longitudinal lines of major elements in turbine disk
(a): Analysis location; (b): Line-1; (c): Line-2: (d): Line-3
(a): Analysis location; (b): Line-1; (c): Line-2: (d): Line-3
Fig. 8. Variation diagram of radial linear distribution of major elements in turbine disk
(a): Line-4 analysis location map; (b): Line-4; (c): Line-5 analysis location map; (d): Line-5
(a): Line-4 analysis location map; (b): Line-4; (c): Line-5 analysis location map; (d): Line-5
Fig. 9. OPA-200 verification content change of major elements in turbine disk
(a): Analysis location; (b): Line-6; (c): Line-7
(a): Analysis location; (b): Line-6; (c): Line-7
|
Table 1. Chemical composition of super alloy spectral reference materials (ω /%)
|
Table 2. The results of chemical method and micro-area X-ray fluorescence spectrum of GH4096 turbine disk (ω %)
| ||||||||||||||||||||||||||||||||||||||||||||||||||||||||||||||||||||||||||||||||
Table 3. In-situ statistical results of major element surface distribution of GH4096 turbine disk


Set citation alerts for the article
Please enter your email address

© Copyright 2018-2021 | Chinese Laser Press. All Rights Reserved 沪ICP备15018463号-20