• Acta Optica Sinica
  • Vol. 38, Issue 10, 1024002 (2018)
Shuaitao Han1、*, Ying Chen1、*, Yuanjian Di1, Lei He1, Xingning Cui1, Qiguang Zhu2, and Shaohua Li3
Author Affiliations
  • 1 Hebei Province Key Laboratory of Test/Measurement Technology and Instrument, School of Electrical Engineering, Yanshan University, Qinhuangdao, Hebei 0 66004, China
  • 2 Key Laboratory for Special Fiber and Fiber Sensor of Hebei Province, School of Information Science and Engineering, Yanshan University, Qinhuangdao, Hebei 0 66004, China
  • 3 Hebei Sailhero Environmental Protection Hi-tech Co., Ltd., Shijiazhuang, Hebei 0 50000, China
  • show less
    DOI: 10.3788/AOS201838.1024002 Cite this Article Set citation alerts
    Shuaitao Han, Ying Chen, Yuanjian Di, Lei He, Xingning Cui, Qiguang Zhu, Shaohua Li. Fano Resonance Dual Mode Performance of Single Baffle Contained MDM Waveguide Coupled Disk Cavity[J]. Acta Optica Sinica, 2018, 38(10): 1024002 Copy Citation Text show less
    Single baffle MDM waveguide coupled disk cavity structure
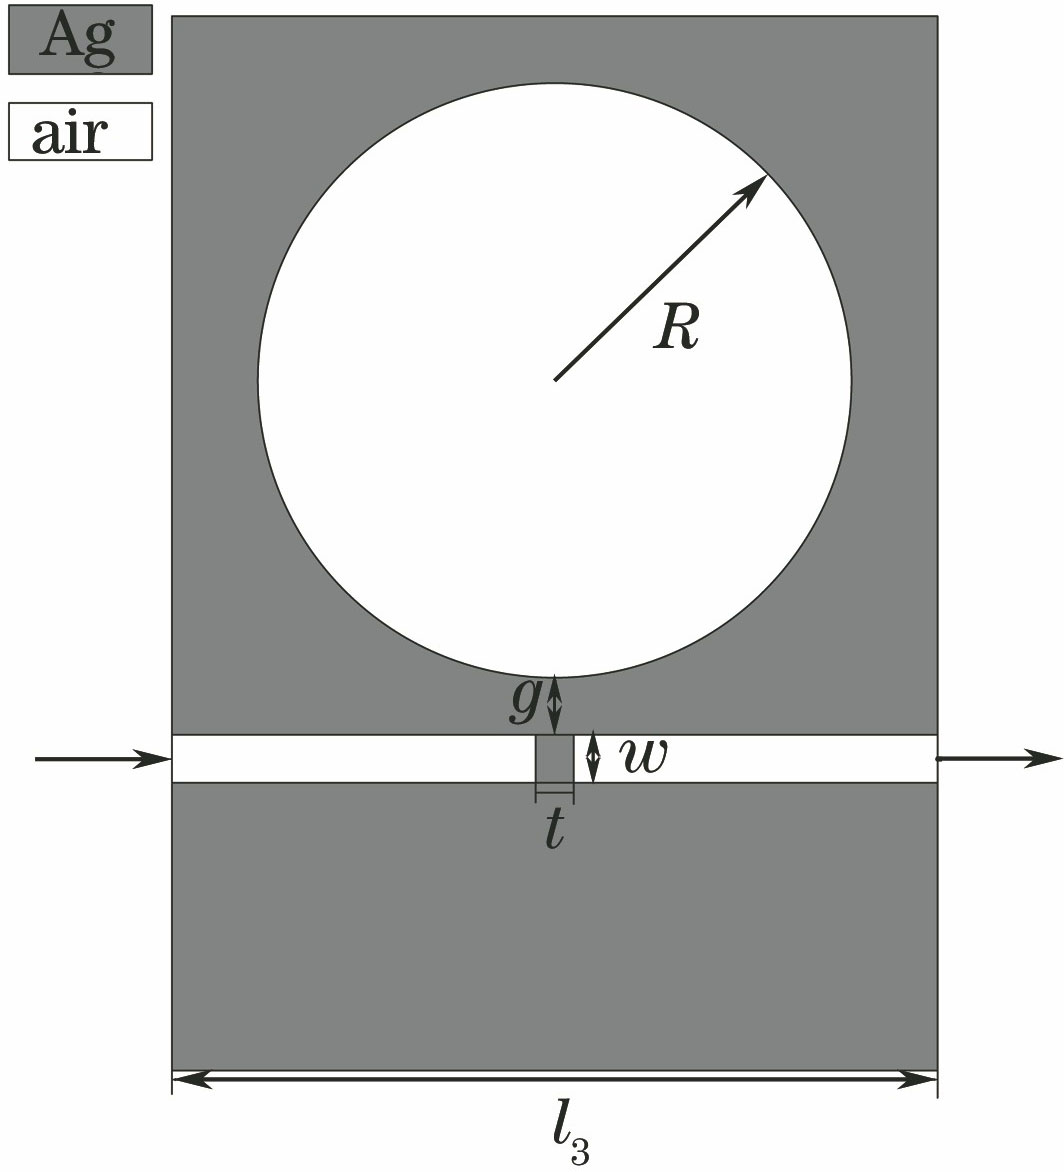
    Fig. 1. Single baffle MDM waveguide coupled disk cavity structure
    Fano resonance formation process. (a) Transmittance spectra when a single baffle or a disk is alone; (b) Fano resonance spectrum of single baffle MDM waveguide coupled disk cavity structure
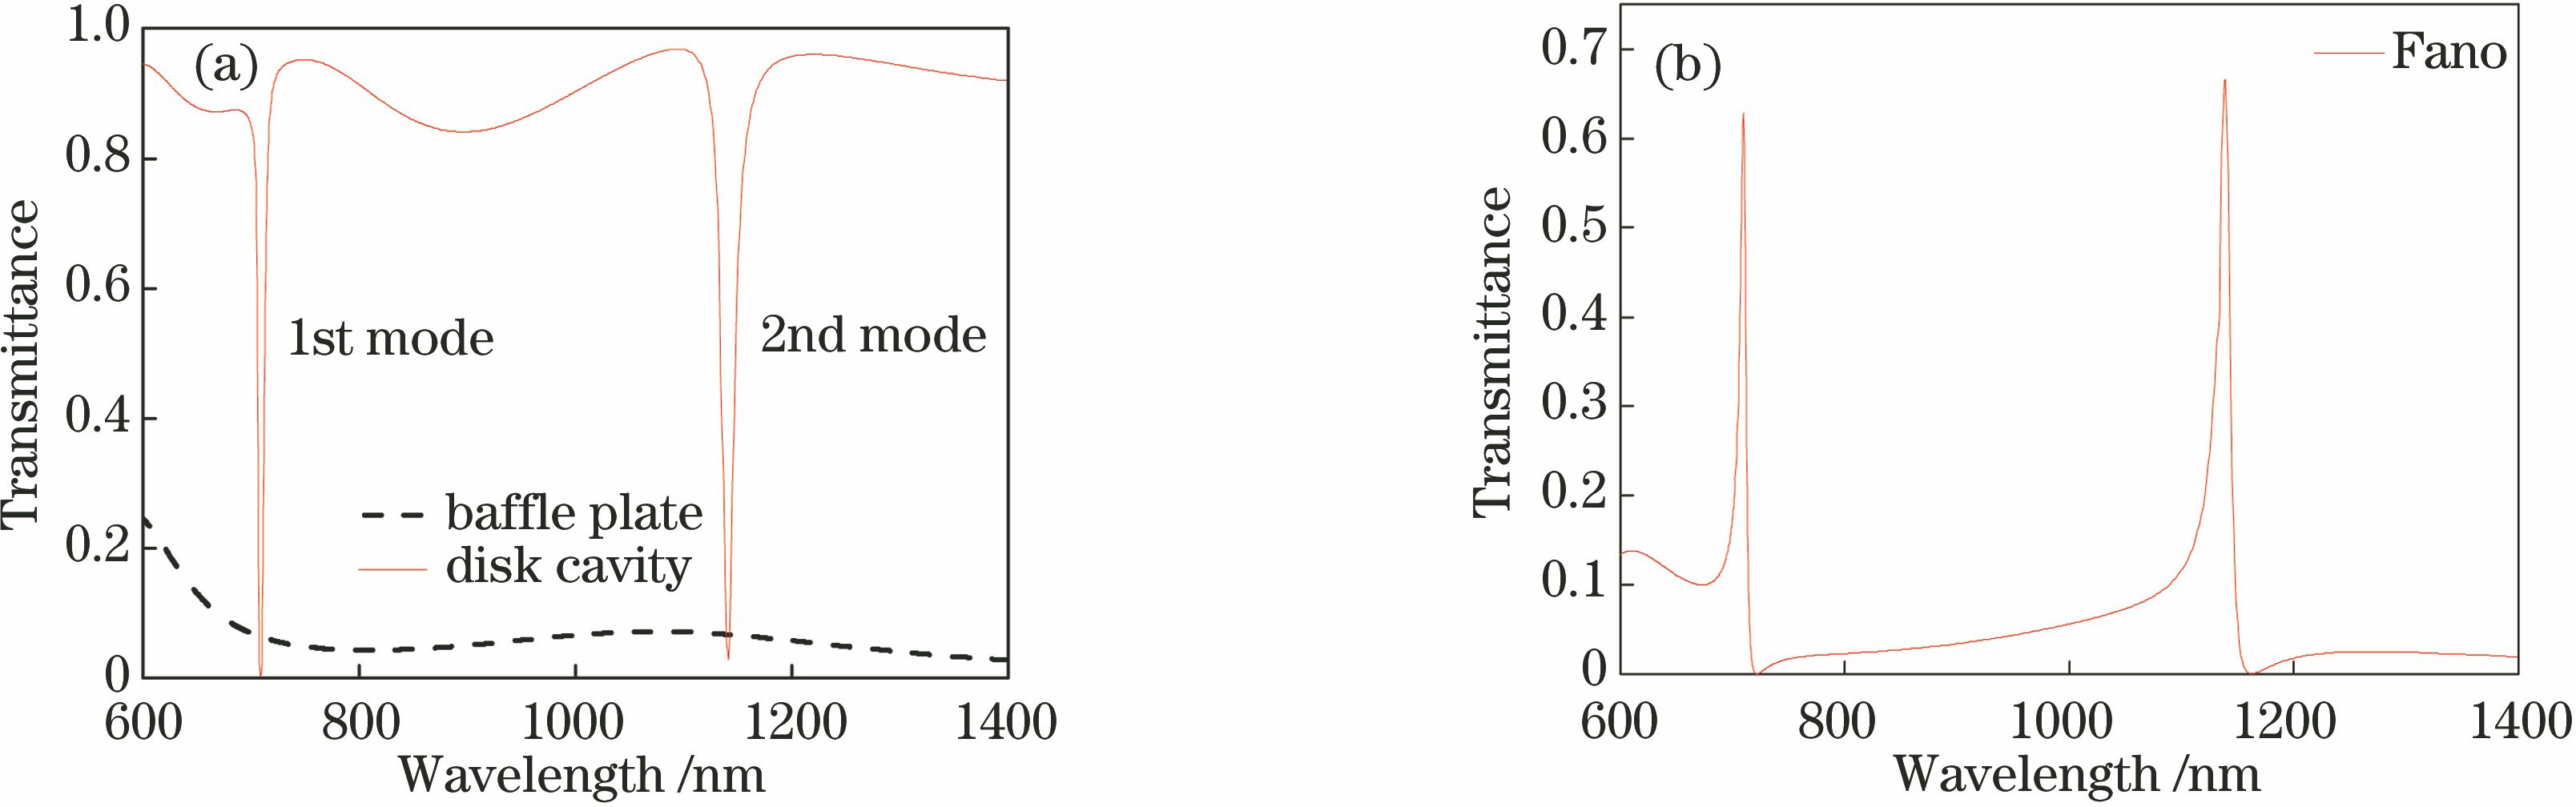
    Fig. 2. Fano resonance formation process. (a) Transmittance spectra when a single baffle or a disk is alone; (b) Fano resonance spectrum of single baffle MDM waveguide coupled disk cavity structure
    Ez field distributions. (a) Ez field distribution at λ=709 nm in the absence of baffle; (b) Ez field distribution at λ=1141 nm in the absence of baffle; (c) Ez field distribution at λ=721 nm after adding baffle; (d) Ez field distribution at λ=1162 nm after adding baffle; (e) Ez field distribution at λ=709 nm after adding baffle; (f) Ez field distribution at λ=1139 nm after adding baffle
    Fig. 3. Ez field distributions. (a) Ez field distribution at λ=709 nm in the absence of baffle; (b) Ez field distribution at λ=1141 nm in the absence of baffle; (c) Ez field distribution at λ=721 nm after adding baffle; (d) Ez field distribution at λ=1162 nm after adding baffle; (e) Ez field distribution at λ=709 nm after adding baffle; (f) Ez field distribution at λ=1139 nm after adding baffle
    Effects of parameter R on resonance peak and FOM value. (a) Effect of parameter R on Fano resonance peaks; (b) effect of parameter R on FOM values at the first mode; (c) effect of parameter R on FOM values at the second mode
    Fig. 4. Effects of parameter R on resonance peak and FOM value. (a) Effect of parameter R on Fano resonance peaks; (b) effect of parameter R on FOM values at the first mode; (c) effect of parameter R on FOM values at the second mode
    Effects of parameter g on resonance peak and FOM values. (a) Effects of parameters g on Fano resonance peak; (b) effects of parameter g on FOM values
    Fig. 5. Effects of parameter g on resonance peak and FOM values. (a) Effects of parameters g on Fano resonance peak; (b) effects of parameter g on FOM values
    FOM values at different wavelengths when parameters are optimal. (a) The first mode; (b) the second mode
    Fig. 6. FOM values at different wavelengths when parameters are optimal. (a) The first mode; (b) the second mode
    Relationship between environmental refractive index n and resonant wavelength λ. (a) Transmission spectra at different environmental refractive indices n; (b) linear relationship between environmental refractive index n and resonant wavelength λ
    Fig. 7. Relationship between environmental refractive index n and resonant wavelength λ. (a) Transmission spectra at different environmental refractive indices n; (b) linear relationship between environmental refractive index n and resonant wavelength λ
    Shuaitao Han, Ying Chen, Yuanjian Di, Lei He, Xingning Cui, Qiguang Zhu, Shaohua Li. Fano Resonance Dual Mode Performance of Single Baffle Contained MDM Waveguide Coupled Disk Cavity[J]. Acta Optica Sinica, 2018, 38(10): 1024002
    Download Citation