- Infrared and Laser Engineering
- Vol. 49, Issue 7, 20190505 (2020)
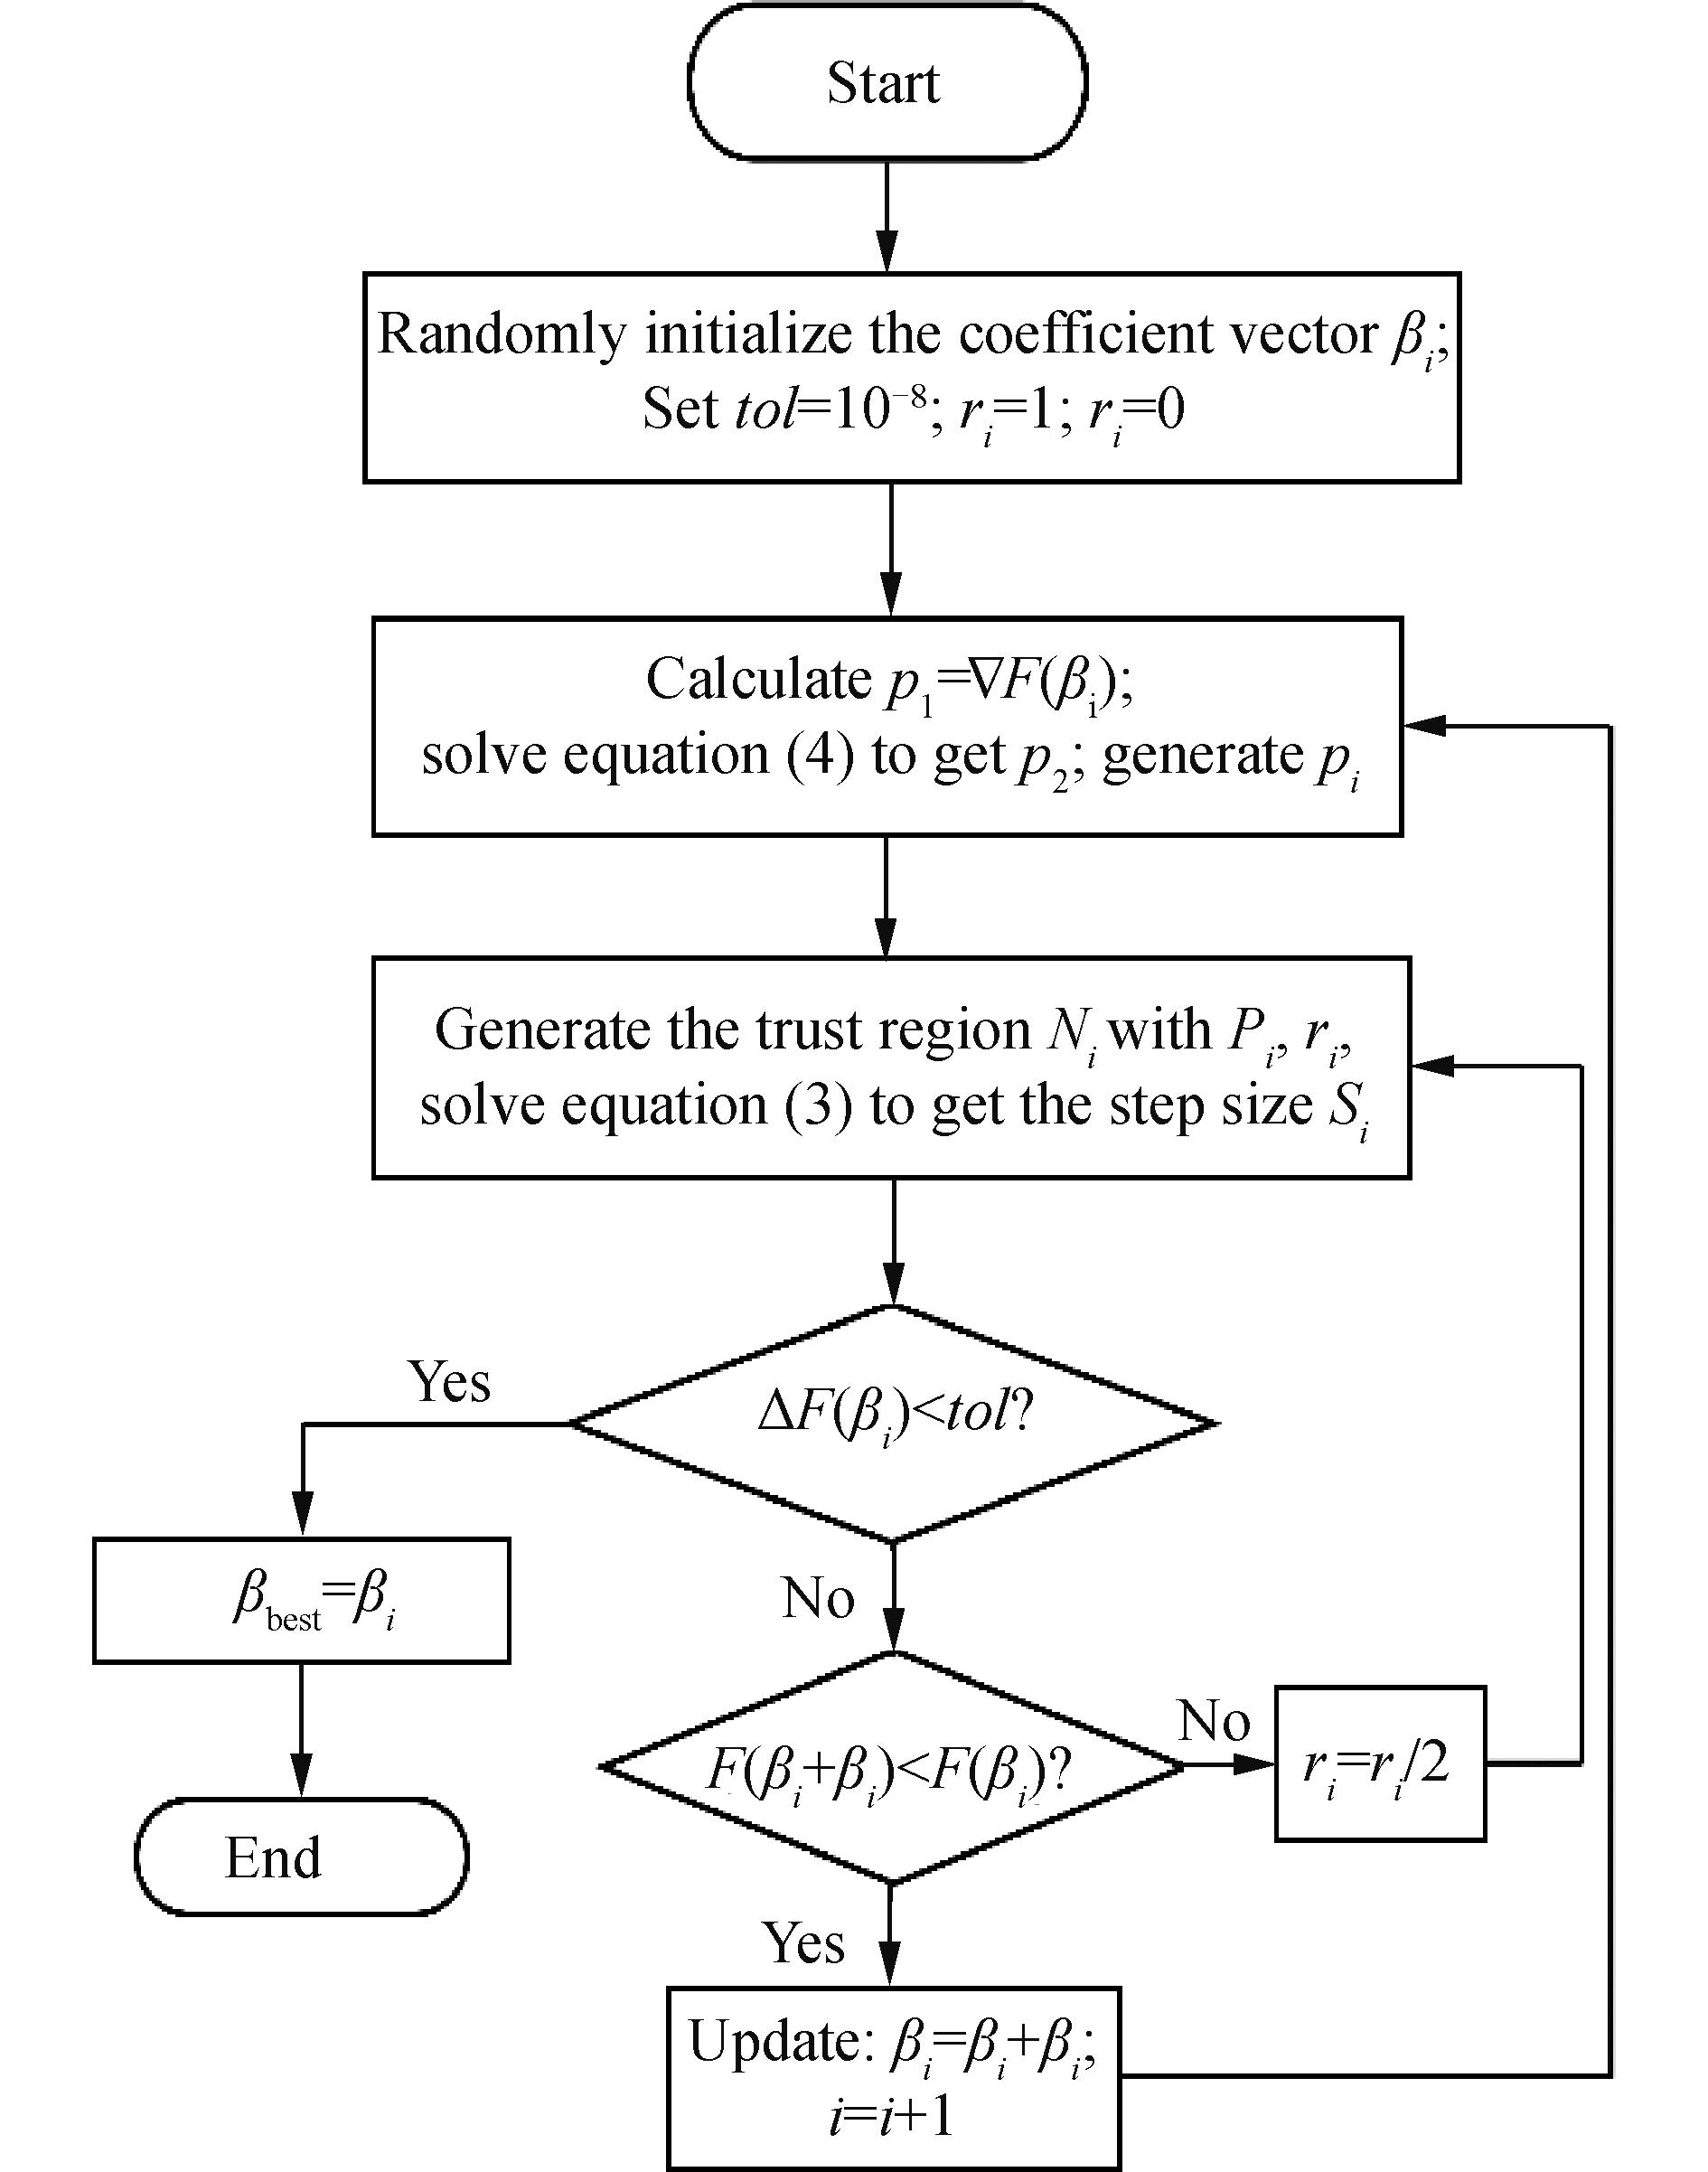
Fig. 1. Flowchart for solving coefficient vector β best by TRR algorithm
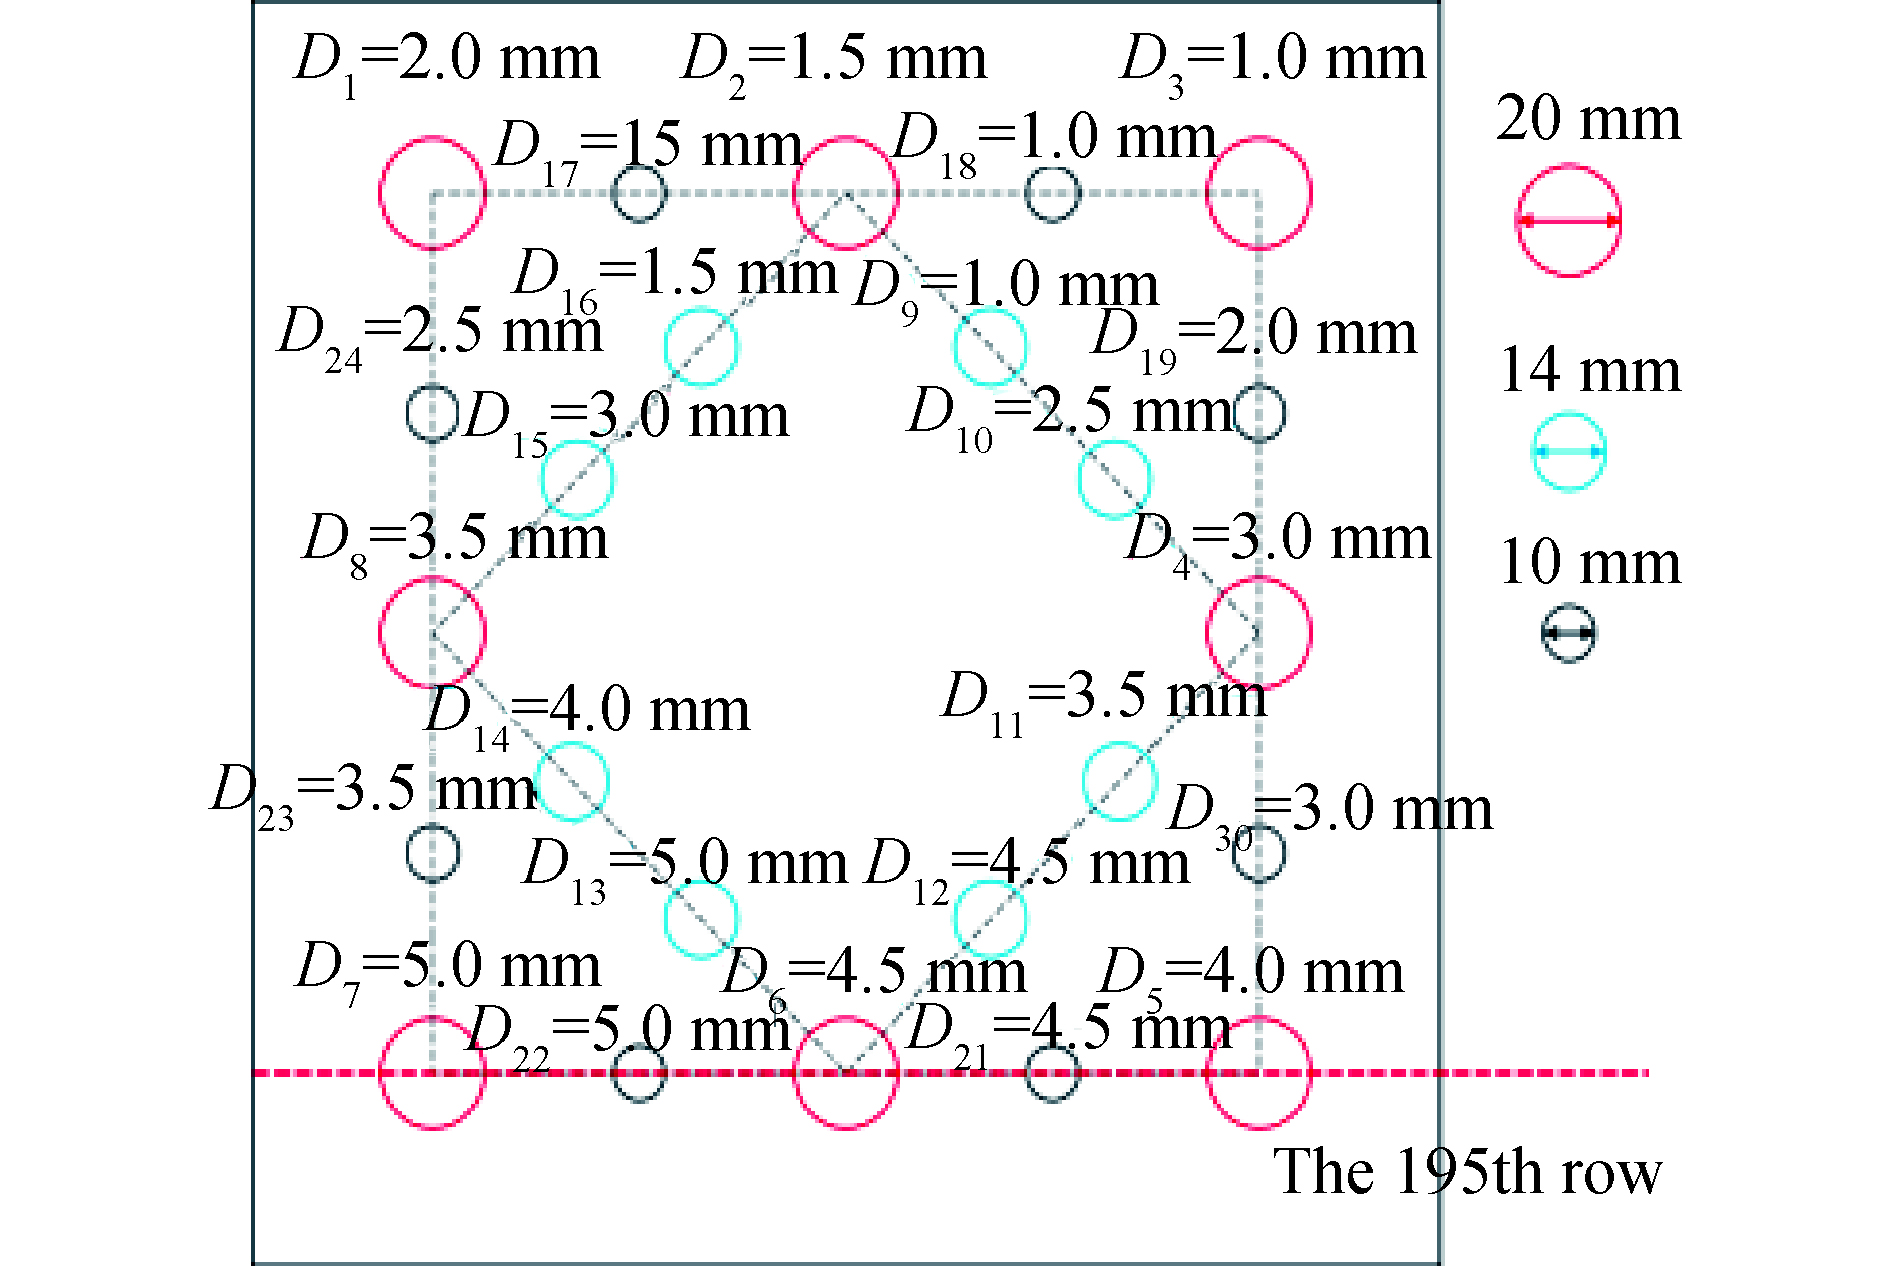
Fig. 2. Schematic diagram of test specimen
Fig. 3. Fitted background image with 10th frame thermographic data of the original thermal image sequence
Fig. 4. Comparison graph of image data in line 195 before and after TRR algorithm processing
Fig. 5. Images of experimental results
Fig. 6. Results of defect segmentation
|
Table 1. Background fitting function coefficients of the 10th frame infrared image

Download Citation


Set citation alerts for the article
Please enter your email address

© Copyright 2018-2021 | Chinese Laser Press. All Rights Reserved 沪ICP备15018463号-20