• Chinese Optics Letters
  • Vol. 21, Issue 5, 051201 (2023)
Fan Zhang, Beibei Qi, Baijin Su, Ou Xu*, and Yuwen Qin
Author Affiliations
  • Institute of Advanced Photonics Technology, School of Information Engineering, and Guangdong Provincial Key Laboratory of Information Photonics Technology, Guangdong University of Technology, Guangzhou 510006, China
  • show less
    DOI: 10.3788/COL202321.051201 Cite this Article Set citation alerts
    Fan Zhang, Beibei Qi, Baijin Su, Ou Xu, Yuwen Qin. High sensitivity all-fiber bend sensor based on modal interferences in a ring core fiber[J]. Chinese Optics Letters, 2023, 21(5): 051201 Copy Citation Text show less
    (a) Schematic of the proposed sensor. Cross-sectional microscope view of (b) RCF and (c) MMF.
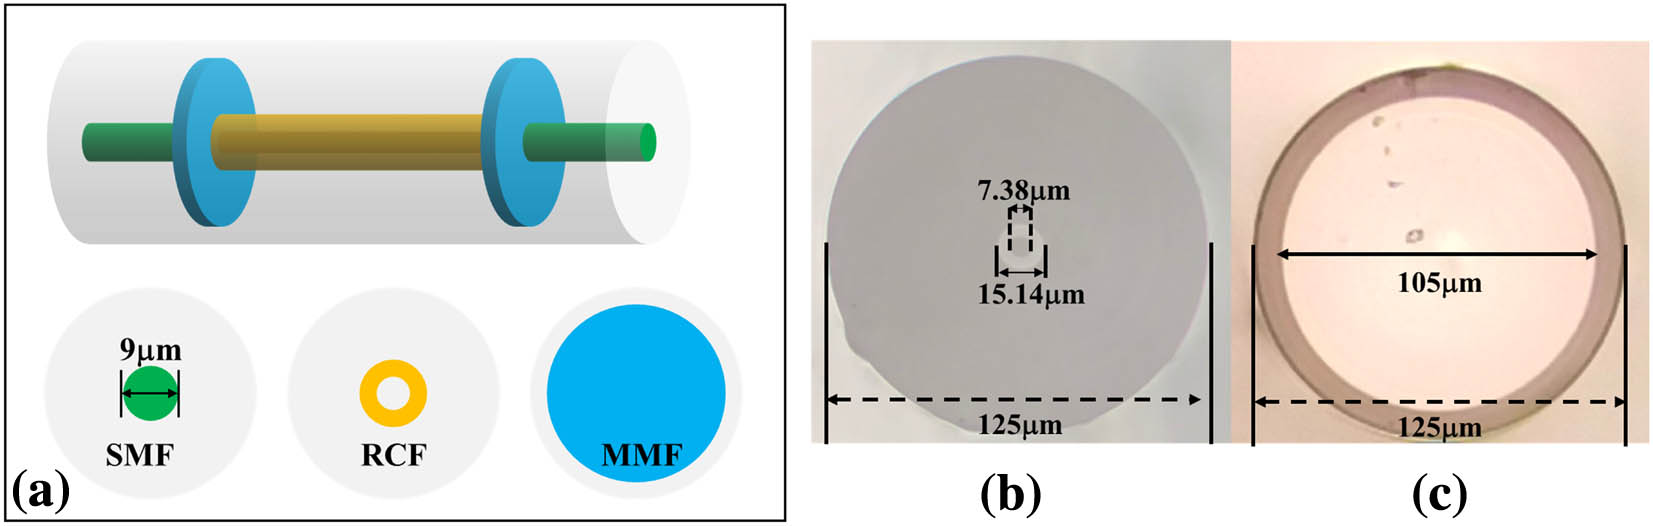
    Fig. 1. (a) Schematic of the proposed sensor. Cross-sectional microscope view of (b) RCF and (c) MMF.
    Propagation field distribution with different structures. (a) SMF–RCF–SMF; (b) SMF–MMF–RCF–SMF; and (c) SMF–MMF–RCF–MMF–SMF.
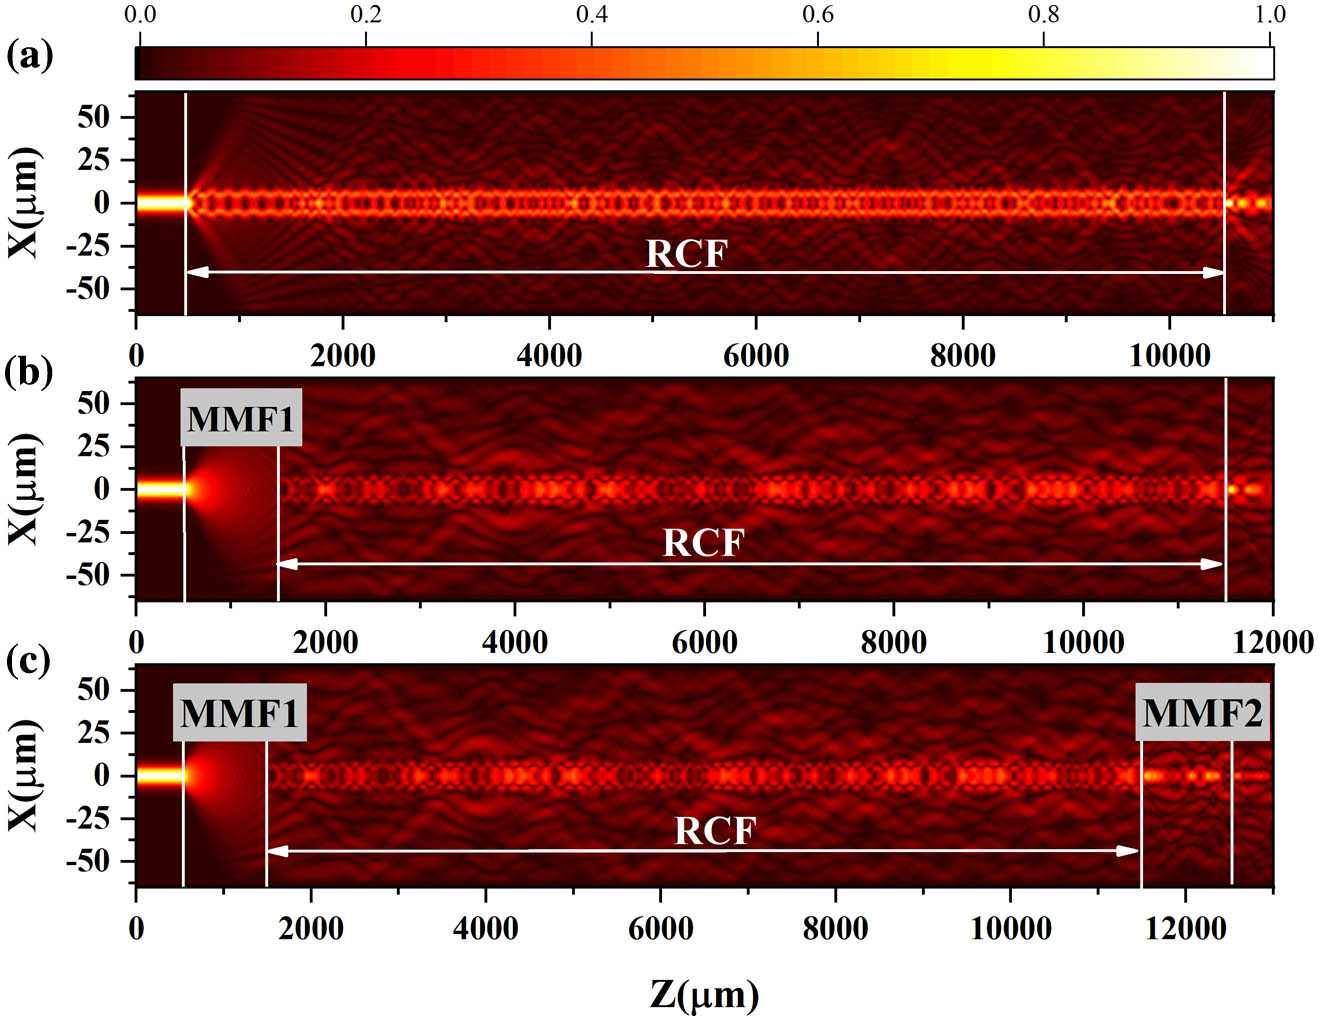
    Fig. 2. Propagation field distribution with different structures. (a) SMF–RCF–SMF; (b) SMF–MMF–RCF–SMF; and (c) SMF–MMF–RCF–MMF–SMF.
    Schematic diagram of the refractive index distribution of straight and bending fibers. The inset shows simulation results of the light field distribution at Z = 6500 µm.
    Fig. 3. Schematic diagram of the refractive index distribution of straight and bending fibers. The inset shows simulation results of the light field distribution at Z = 6500 µm.
    (a) Measured transmission spectrum; (b) FFT of measured spectrum.
    Fig. 4. (a) Measured transmission spectrum; (b) FFT of measured spectrum.
    Mode field distribution are obtained by using FEM. (a) LP21; (b) LP31; (c) LP29.
    Fig. 5. Mode field distribution are obtained by using FEM. (a) LP21; (b) LP31; (c) LP29.
    Experimental setup for the curvature measurement.
    Fig. 6. Experimental setup for the curvature measurement.
    (a) Interference dip (at 1450 nm) evolution with different curvatures; (b) average wavelength-bending response with error bars for four testing results; the inset shows linear fitting of the four measurements.
    Fig. 7. (a) Interference dip (at 1450 nm) evolution with different curvatures; (b) average wavelength-bending response with error bars for four testing results; the inset shows linear fitting of the four measurements.
    Average intensity-bending response with error bars for four testing results; the inset shows the linear fitting of the four measurements.
    Fig. 8. Average intensity-bending response with error bars for four testing results; the inset shows the linear fitting of the four measurements.
    (a) Spectral responses under different temperatures; (b) wavelength and intensity response to temperature.
    Fig. 9. (a) Spectral responses under different temperatures; (b) wavelength and intensity response to temperature.
    StructureSensitivity (dB/m-1)Complexity of Manufacturing ProcessRef.
    Helicoidal LPFGs4.1Complex[21]
    Superimposed grating0.6Complex[16]
    Fiber spindle arrays−38.4Moderate[17]
    NCF–SCF–NCF10.22Simple[22]
    SMF helical−7.524Complex[18]
    Taper–DCF2.88Simple[23]
    MMF–RCF–MMF−25.63SimpleThis work
    Table 1. Performance Comparison between Our Sensors and Other Sensors
    Fan Zhang, Beibei Qi, Baijin Su, Ou Xu, Yuwen Qin. High sensitivity all-fiber bend sensor based on modal interferences in a ring core fiber[J]. Chinese Optics Letters, 2023, 21(5): 051201
    Download Citation