
Lu Ren, Qiang Li, Xin Guan, Jie Ma. Three-Dimensional Segmentation of Brain Tumors in Magnetic Resonance Imaging Based on Improved Continuous Max-Flow[J]. Laser & Optoelectronics Progress, 2018, 55(11): 111011
- Laser & Optoelectronics Progress
- Vol. 55, Issue 11, 111011 (2018)
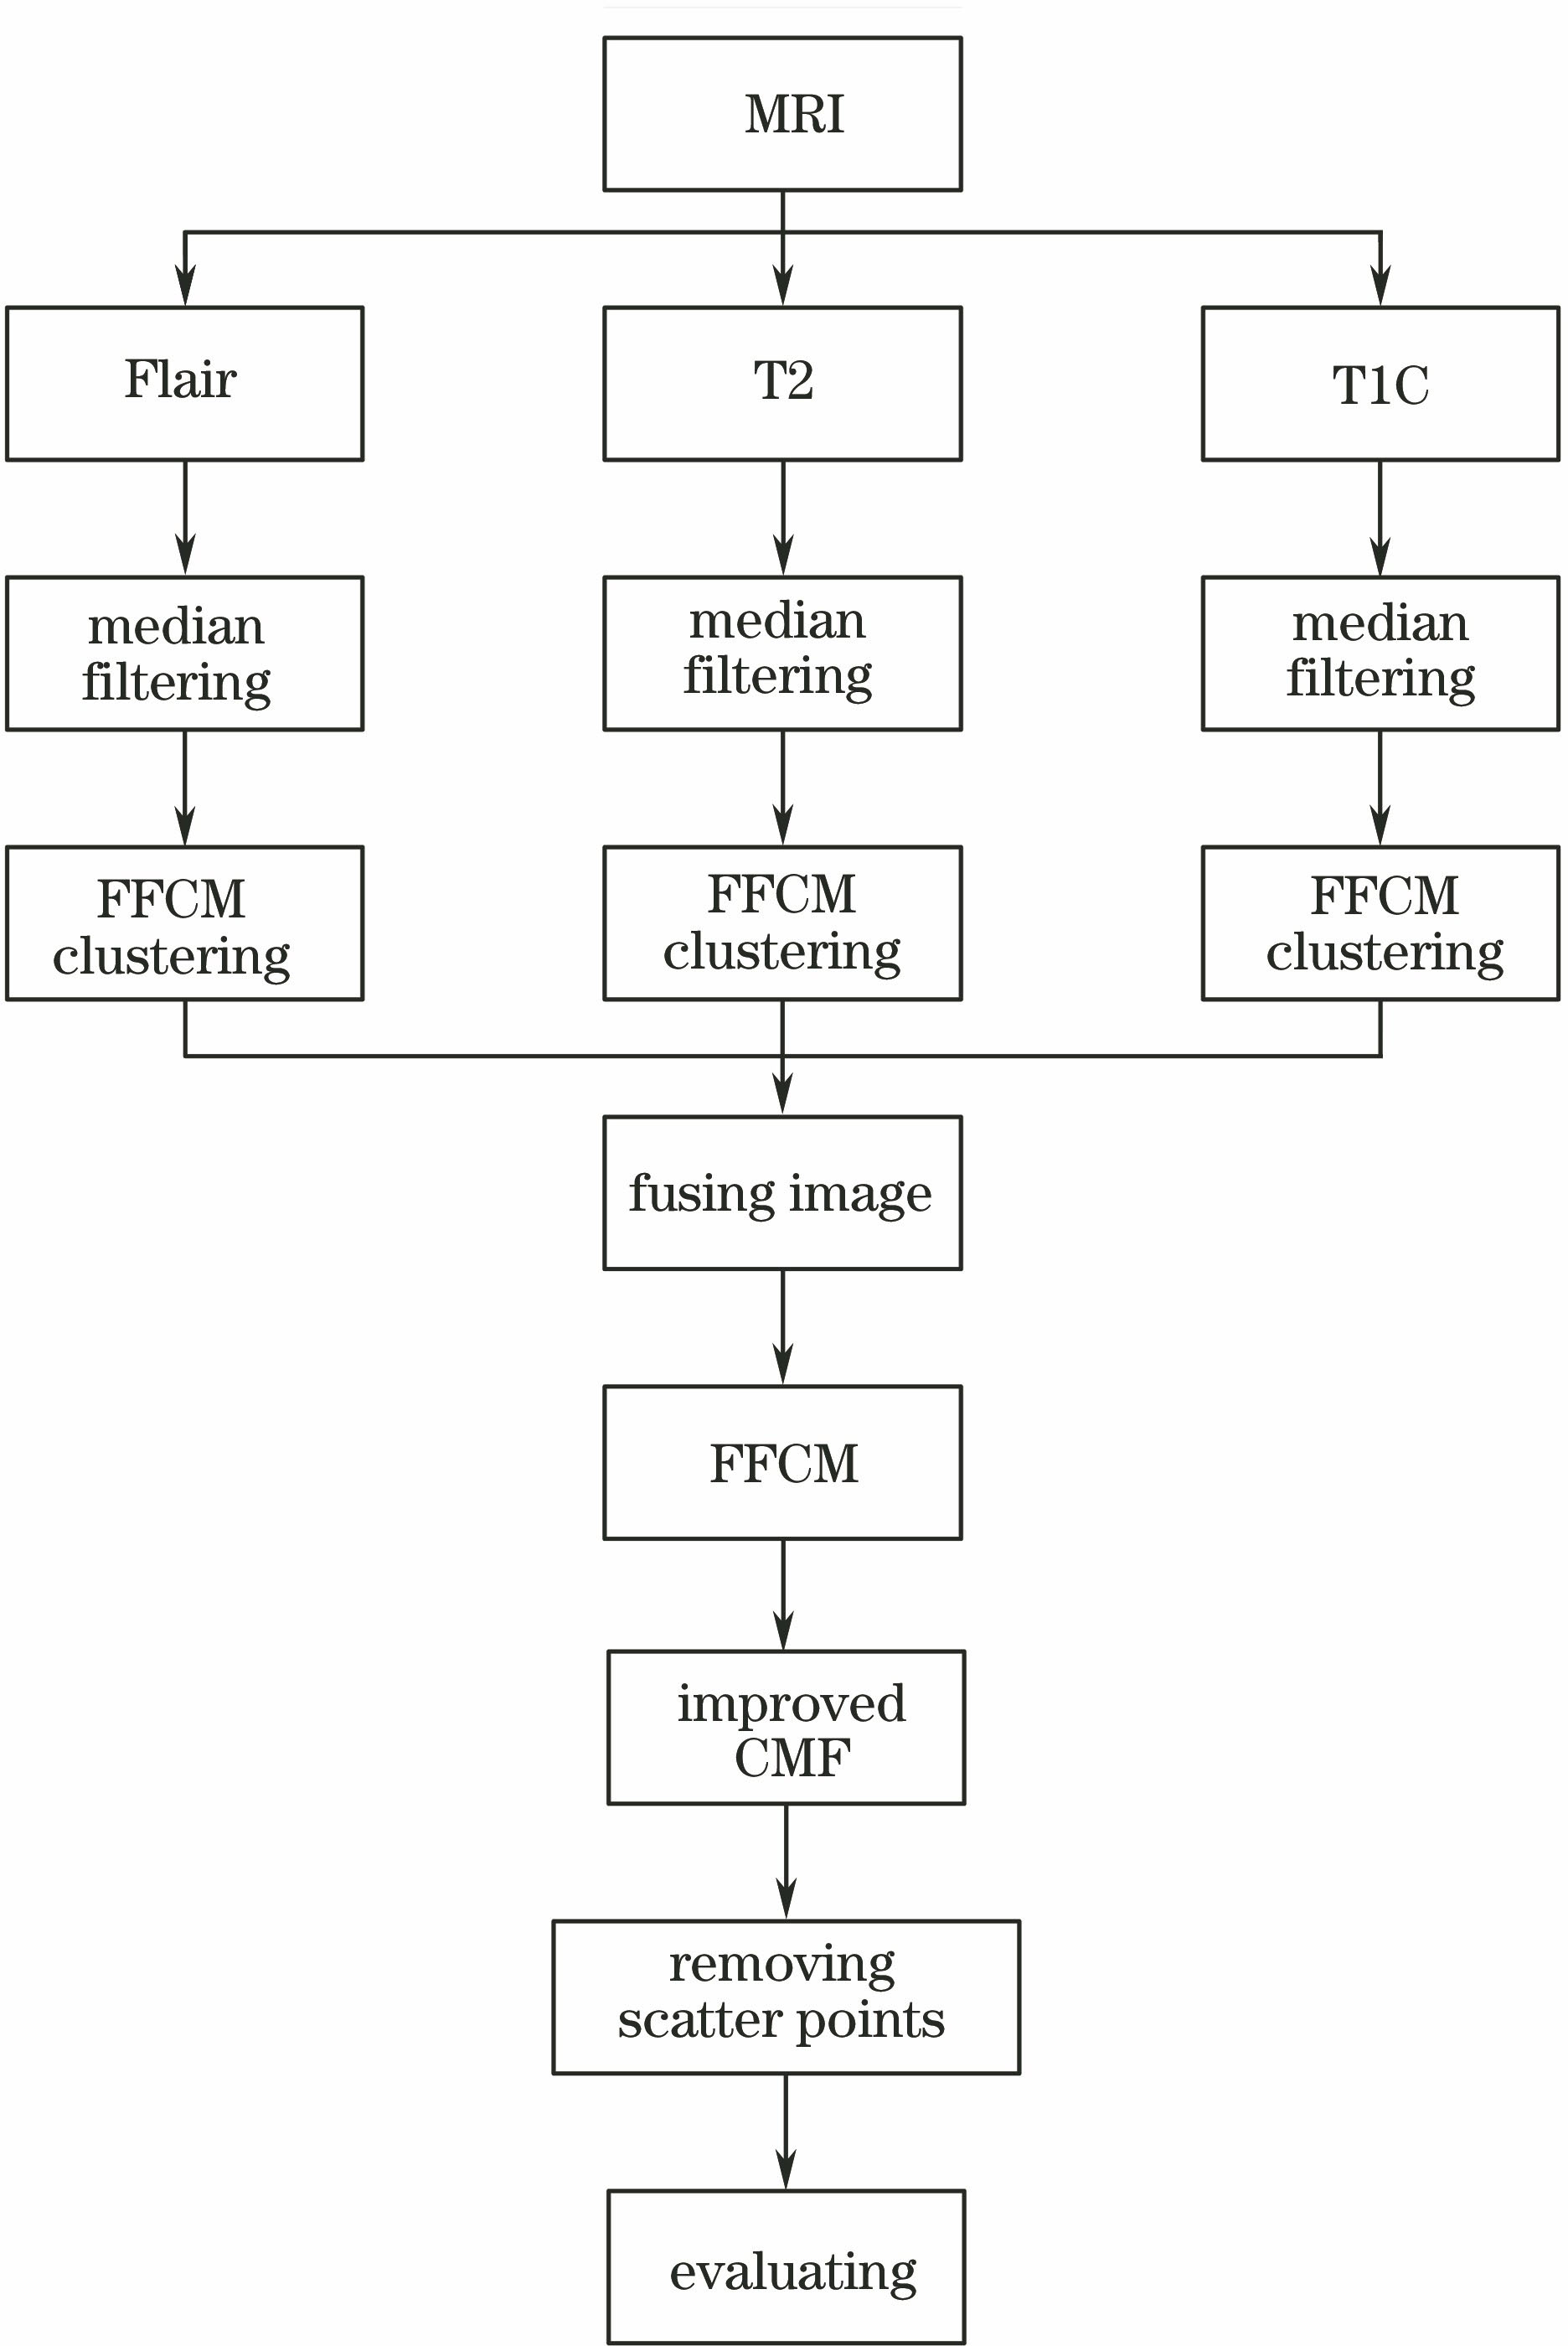
Fig. 1. Framework of the segmentation algorithm proposed
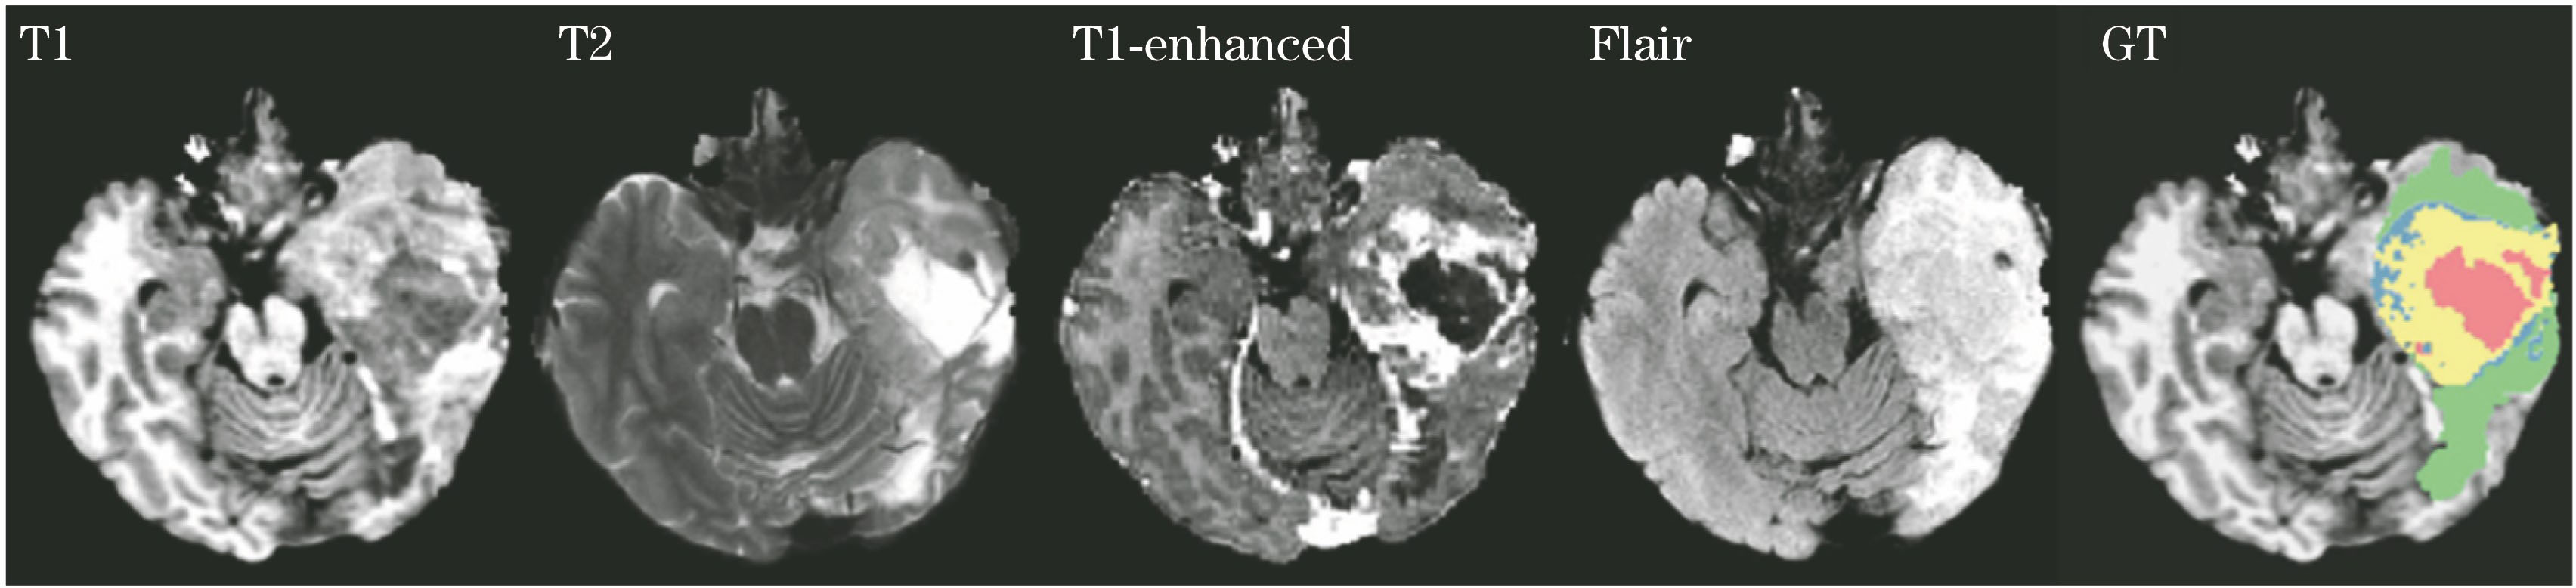
Fig. 2. Four types of brain tumor MRI images and the expert segmentation result
Fig. 3. Three types of brain tumor MRI images and the fused image. (a) Flair; (b) T1C; (c) T2; (d) fused image
Fig. 4. Histograms of three types of brain tumor MRI images and the fused image. (a) Flair; (b) T1C; (c) T2; (d) fused image
Fig. 5. Main steps of HGG 3D segmentation. (a) Under-segmented image; (b) accurate-segmented image; (c) final segmented result; (d) gold standard
Fig. 6. Main steps of LGG 3D segmentation. (a) Under-segmented image; (b) accurate-segmented image; (c) final segmented result; (d) gold standard
|
Table 1. Processing result of 45 images for different ratios
|
Table 2. Segmentation of the HGG in various directions
|
Table 3. Segmentation of the LGG in various directions
|
Table 4. Segmentation performance evaluation of improved FCM segmentation method
|
Table 5. Index statistics of HGG, LGG and all data
|
Table 6. Segmentation performance evaluation of three segmentation methods

Set citation alerts for the article
Please enter your email address
© Copyright 2018-2021 | Chinese Laser Press. All Rights Reserved 沪ICP备15018463号-20