• Chinese Optics Letters
  • Vol. 13, Issue 5, 051401 (2015)
Liqiang Yu, Lu Guo, Dan Lu*, Chen Ji, Hao Wang, and Lingjuan Zhao
Author Affiliations
  • Key Laboratory of Semiconductor Materials Science, Institute of Semiconductors, Chinese Academy of Sciences, Beijing 100086, China
  • show less
    DOI: 10.3788/COL201513.051401 Cite this Article Set citation alerts
    Liqiang Yu, Lu Guo, Dan Lu, Chen Ji, Hao Wang, Lingjuan Zhao. Modulated bandwidth enhancement in an amplified feedback laser[J]. Chinese Optics Letters, 2015, 13(5): 051401 Copy Citation Text show less
    Schematic diagram of the monolithically integrated AFL. It consists of a DFB section, a phase section, and an amplified section.
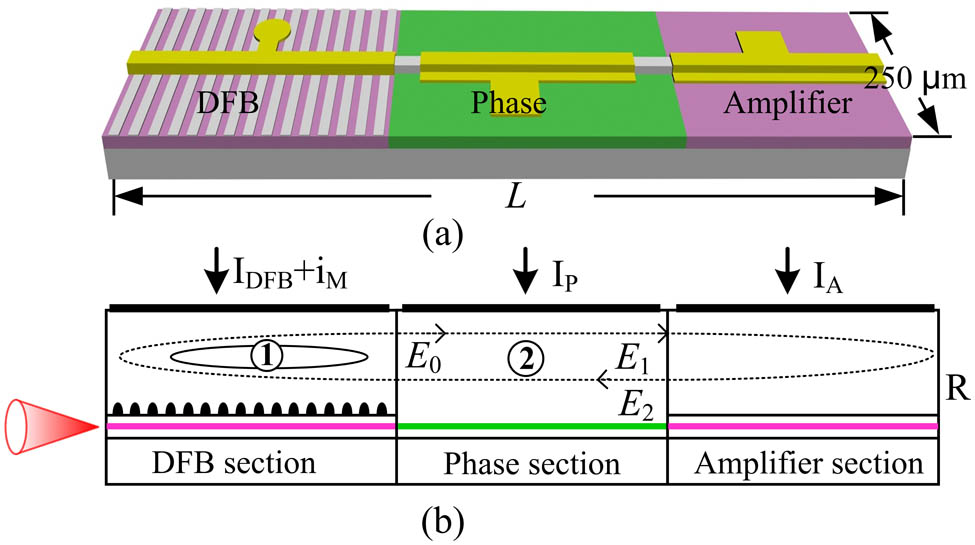
    Fig. 1. Schematic diagram of the monolithically integrated AFL. It consists of a DFB section, a phase section, and an amplified section.
    Various lasing states of the device for IDFB=90 mA and IP=0 mA. IA varies from top to bottom as (a) 5, (b) 20, and (c) 15 mA. (a1)–(c1) Measured optical spectra. (a2)–(c2) Measured RF power spectra. (a3)–(c3) Measured small-signal responses. Here, the temperature is 22 °C.
    Fig. 2. Various lasing states of the device for IDFB=90mA and IP=0mA. IA varies from top to bottom as (a) 5, (b) 20, and (c) 15 mA. (a1)–(c1) Measured optical spectra. (a2)–(c2) Measured RF power spectra. (a3)–(c3) Measured small-signal responses. Here, the temperature is 22 °C.
    Various lasing states of the device for IDFB=90 mA and IP=0 mA. IA varies from 15 to 19 mA. (a) Optical spectra. (b) Small-signal modulated responses. Here, the temperature is 22 °C.
    Fig. 3. Various lasing states of the device for IDFB=90mA and IP=0mA. IA varies from 15 to 19 mA. (a) Optical spectra. (b) Small-signal modulated responses. Here, the temperature is 22 °C.
    (a) Experimentally measured mapping of the mode-beating frequency in the plane of phase and amplified section currents for IDFB=90 mA. The white areas correspond to the CW output. The different levels of color represent the beating output with different frequencies ranging from 10 to 40 GHz. (b) An example of the RF spectra with beating frequency tuning from 30 to 40 GHz. Here, the bias currents vary along the black row marked in (a).
    Fig. 4. (a) Experimentally measured mapping of the mode-beating frequency in the plane of phase and amplified section currents for IDFB=90mA. The white areas correspond to the CW output. The different levels of color represent the beating output with different frequencies ranging from 10 to 40 GHz. (b) An example of the RF spectra with beating frequency tuning from 30 to 40 GHz. Here, the bias currents vary along the black row marked in (a).
    Measured small-signal modulated responses at different temperatures. Here, the DFB and phase currents are fixed at 80 and 0 mA, respectively. The amplified current is adjusted slightly to enable the laser to lie in the states of enhancing the modulated bandwidth. The inset shows that the −3 dB bandwidth (ƒ3 dB) varies from 24 to 27 GHz.
    Fig. 5. Measured small-signal modulated responses at different temperatures. Here, the DFB and phase currents are fixed at 80 and 0 mA, respectively. The amplified current is adjusted slightly to enable the laser to lie in the states of enhancing the modulated bandwidth. The inset shows that the 3dB bandwidth (ƒ3dB) varies from 24 to 27 GHz.
    (a) Mapping of the mode-beating frequency of the AFL in the plane of phase and the amplified section currents when IDFB is 80 mA. The white areas correspond to the CW output. The different levels of color represent the beating outputs of different frequencies from 8 to 35 GHz. The five dots represent the different working conditions of the AFL. (b) Beating frequency tuning of the PFL for different IP when IDFB is 80 mA.
    Fig. 6. (a) Mapping of the mode-beating frequency of the AFL in the plane of phase and the amplified section currents when IDFB is 80 mA. The white areas correspond to the CW output. The different levels of color represent the beating outputs of different frequencies from 8 to 35 GHz. The five dots represent the different working conditions of the AFL. (b) Beating frequency tuning of the PFL for different IP when IDFB is 80 mA.
    Simulated small-signal modulated response of the AFL with different IA. Here, IDFB and IP are fixed at 80 and 29 mA, respectively. The different working conditions are marked in Fig. 2 with black dots.
    Fig. 7. Simulated small-signal modulated response of the AFL with different IA. Here, IDFB and IP are fixed at 80 and 29 mA, respectively. The different working conditions are marked in Fig. 2 with black dots.
    Normalized small-signal response of the AFL with different feedback lengths. Here, LDFB and LA are fixed at 220 and 320 μm, and LP is varied from 340 to 800 μm. IDFB and IP are fixed at 80 and 29 mA, respectively, while IA is adjusted to make the −3 dB bandwidth (ƒ3 dB) as high as possible. IA is 25, 50, and 67 mA. We also make sure that the gap between the CP and PP resonances is fully filled.
    Fig. 8. Normalized small-signal response of the AFL with different feedback lengths. Here, LDFB and LA are fixed at 220 and 320 μm, and LP is varied from 340 to 800 μm. IDFB and IP are fixed at 80 and 29 mA, respectively, while IA is adjusted to make the 3dB bandwidth (ƒ3dB) as high as possible. IA is 25, 50, and 67 mA. We also make sure that the gap between the CP and PP resonances is fully filled.
     Values
    ExplanationDFBPhaseAmplifierUnit
    Nominal Wavelength (λ0)1.5531.5531.553μm
    Section Length (L)220340320μm
    Section Width (W)2.52.52.5μm
    Group Velocity Index (n)3.73.73.7
    Index Grating Coupling Coefficient (κi)60cm1
    Gain Grating Coupling Coefficient (κg)20cm1
    Internal Loss (a)303030cm1
    Linewidth Enhancement Factor (αH)33
    Linear Recombination Coefficient (A)3×1083×1083×108s1
    Bimolecular Recombination Coefficient (B)1.0×10161.0×10161.0×1016m3/s
    Auger Recombination Coefficient (C)1.3×10411.3×10411.3×1041m6/s
    Transparency Carrier Density (N0)1.5×10241.5×1024m3/s
    Linear Material Gain Coefficient30×102130×1021m2
    Reflectivity of facets (R)0.30.3
    Table 1. Parameters Used in Simulation
    Liqiang Yu, Lu Guo, Dan Lu, Chen Ji, Hao Wang, Lingjuan Zhao. Modulated bandwidth enhancement in an amplified feedback laser[J]. Chinese Optics Letters, 2015, 13(5): 051401
    Download Citation