
Ding Chen, Jiangning Xu, Shan Jiang, Miao Wu. Method for Real-Time Temperature Measurement of Optical Fiber Link in Loopback Time Service System to Deduce One-Way Delay[J]. Laser & Optoelectronics Progress, 2021, 58(23): 2306009
- Laser & Optoelectronics Progress
- Vol. 58, Issue 23, 2306009 (2021)
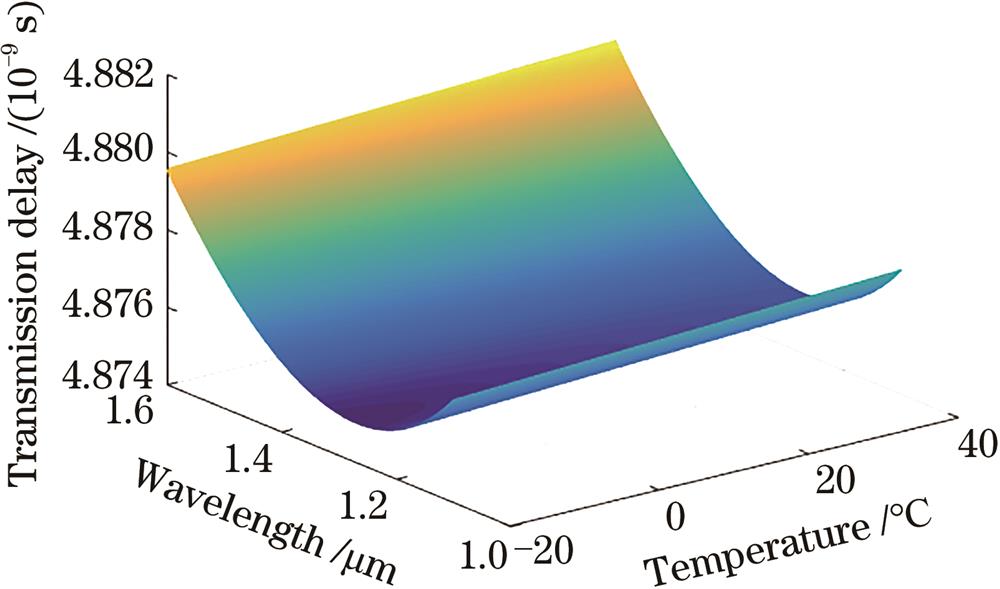
Fig. 1. Transmission delay characteristic of unit length optical fiber link
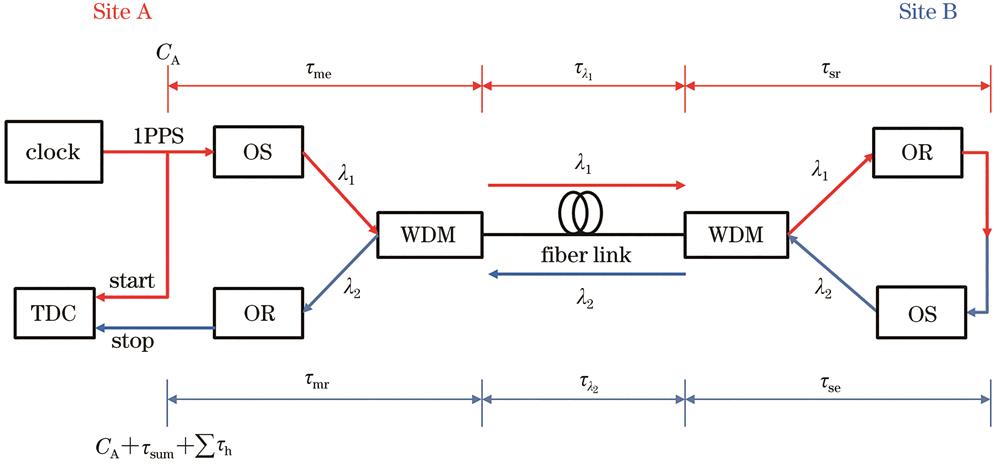
Fig. 2. Schematic diagram of optical fiber link temperature measurement system
Fig. 3. Flow chart of optical fiber link temperature measurement system
Fig. 4. Segmented temperature model of optical fiber time synchronization link
Fig. 5. Temperature change of each section of optical fiber link within 24 hours
Fig. 6. Simulation results of 100-km optical fiber link. (a) Round-trip delay;(b) unidirectional transmission delay;(c) equivalent average temperature
Fig. 7. Estimation accuracy of 100-km one-way delay. (a) Without considering Time interval counter resolution,(b) considering Time interval counter resolution
Fig. 8. Physical diagrams of experimental platform. (a) Terminal equipment and optical fiber link;(b) temperature control box
Fig. 9. Round-trip delay and temperature of temperature control box
Fig. 10. Round trip delay after Kalman filtering
Fig. 11. Temperature of temperature control box and estimated temperature of link
Fig. 12. Estimated link temperature
|
Table 1. Experimental related parameters

Set citation alerts for the article
Please enter your email address
© Copyright 2018-2021 | Chinese Laser Press. All Rights Reserved 沪ICP备15018463号-20