- Spectroscopy and Spectral Analysis
- Vol. 42, Issue 10, 3253 (2022)
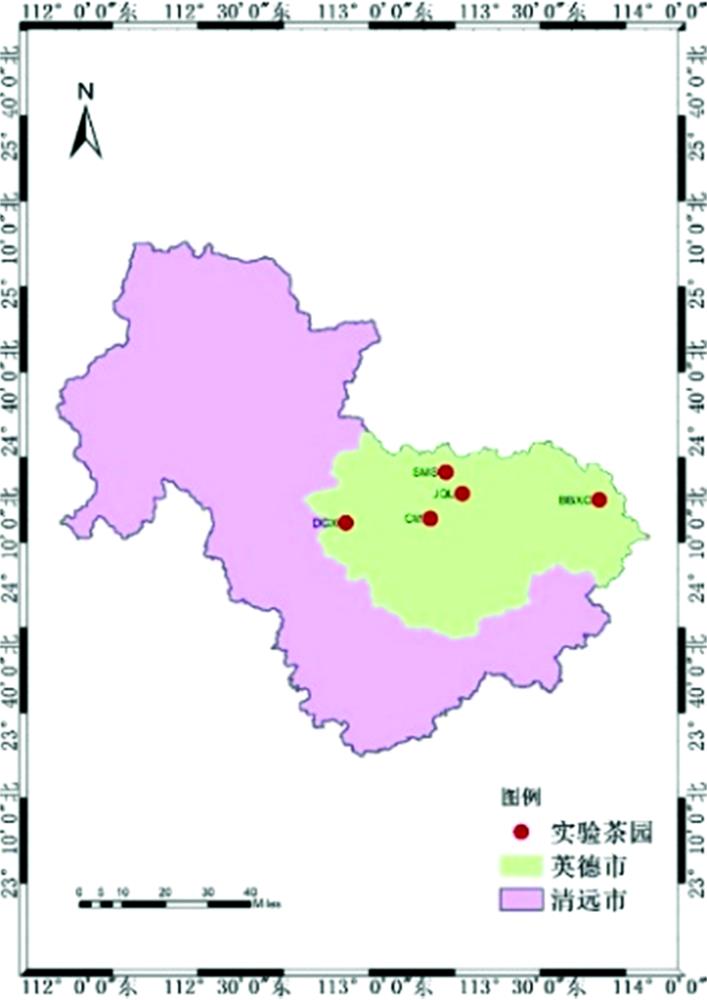
Fig. 1. Spatial distribution of study area
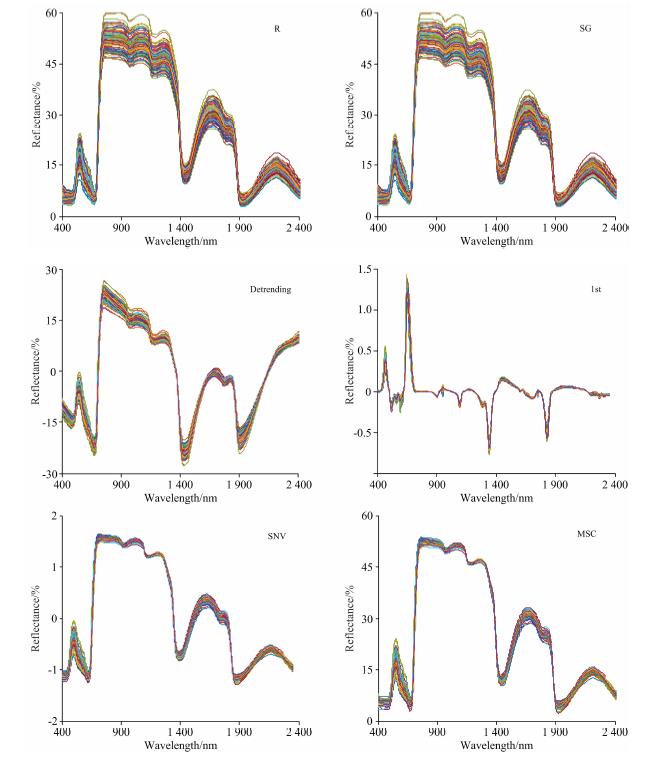
Fig. 2. Reflectance spectra with different pre-processing methods
Fig. 3. Spectral characteristics of wavelet transform
Fig. 4. Correlation analysis of wavelet transform
Fig. 5. The variables selected by SPA, CARS and VCPA
Fig. 6. Fitting diagrams of the optimal models of tea nitrogen based on (a) CWT (1 scale)-SPA-PLS, (b) CWT (1 scale)-CARS-PLS and (c) CWT (1 scale)-VCPA-PLS
| ||||||||||||||||||||||||||||||||||||||||||||||||||||||||||||||||||||||||||||||||||||||||||||||||||||||||||||||||||||
Table 1. Models based on different preprocessing methods and variables selection methods
| ||||||||||||||||||||||||||||||||||||||||||||||||||||||||||||||||||||||||||||||||||||||||||||||||||||||||||||||||||||||||||
Table 2. Models based on different decomposition scales and variables selection methods

Download Citation

Set citation alerts for the article
Please enter your email address
© Copyright 2018-2021 | Chinese Laser Press. All Rights Reserved 沪ICP备15018463号-20