
Yuanyuan Liu, Yongbin Yang, Wenshuai Feng, Haicheng Yu. Self-Assessment Technique for Fiber Optic Gyroscope Test Environment Based on Fourier Transform[J]. Acta Optica Sinica, 2019, 39(4): 0406002
- Acta Optica Sinica
- Vol. 39, Issue 4, 0406002 (2019)
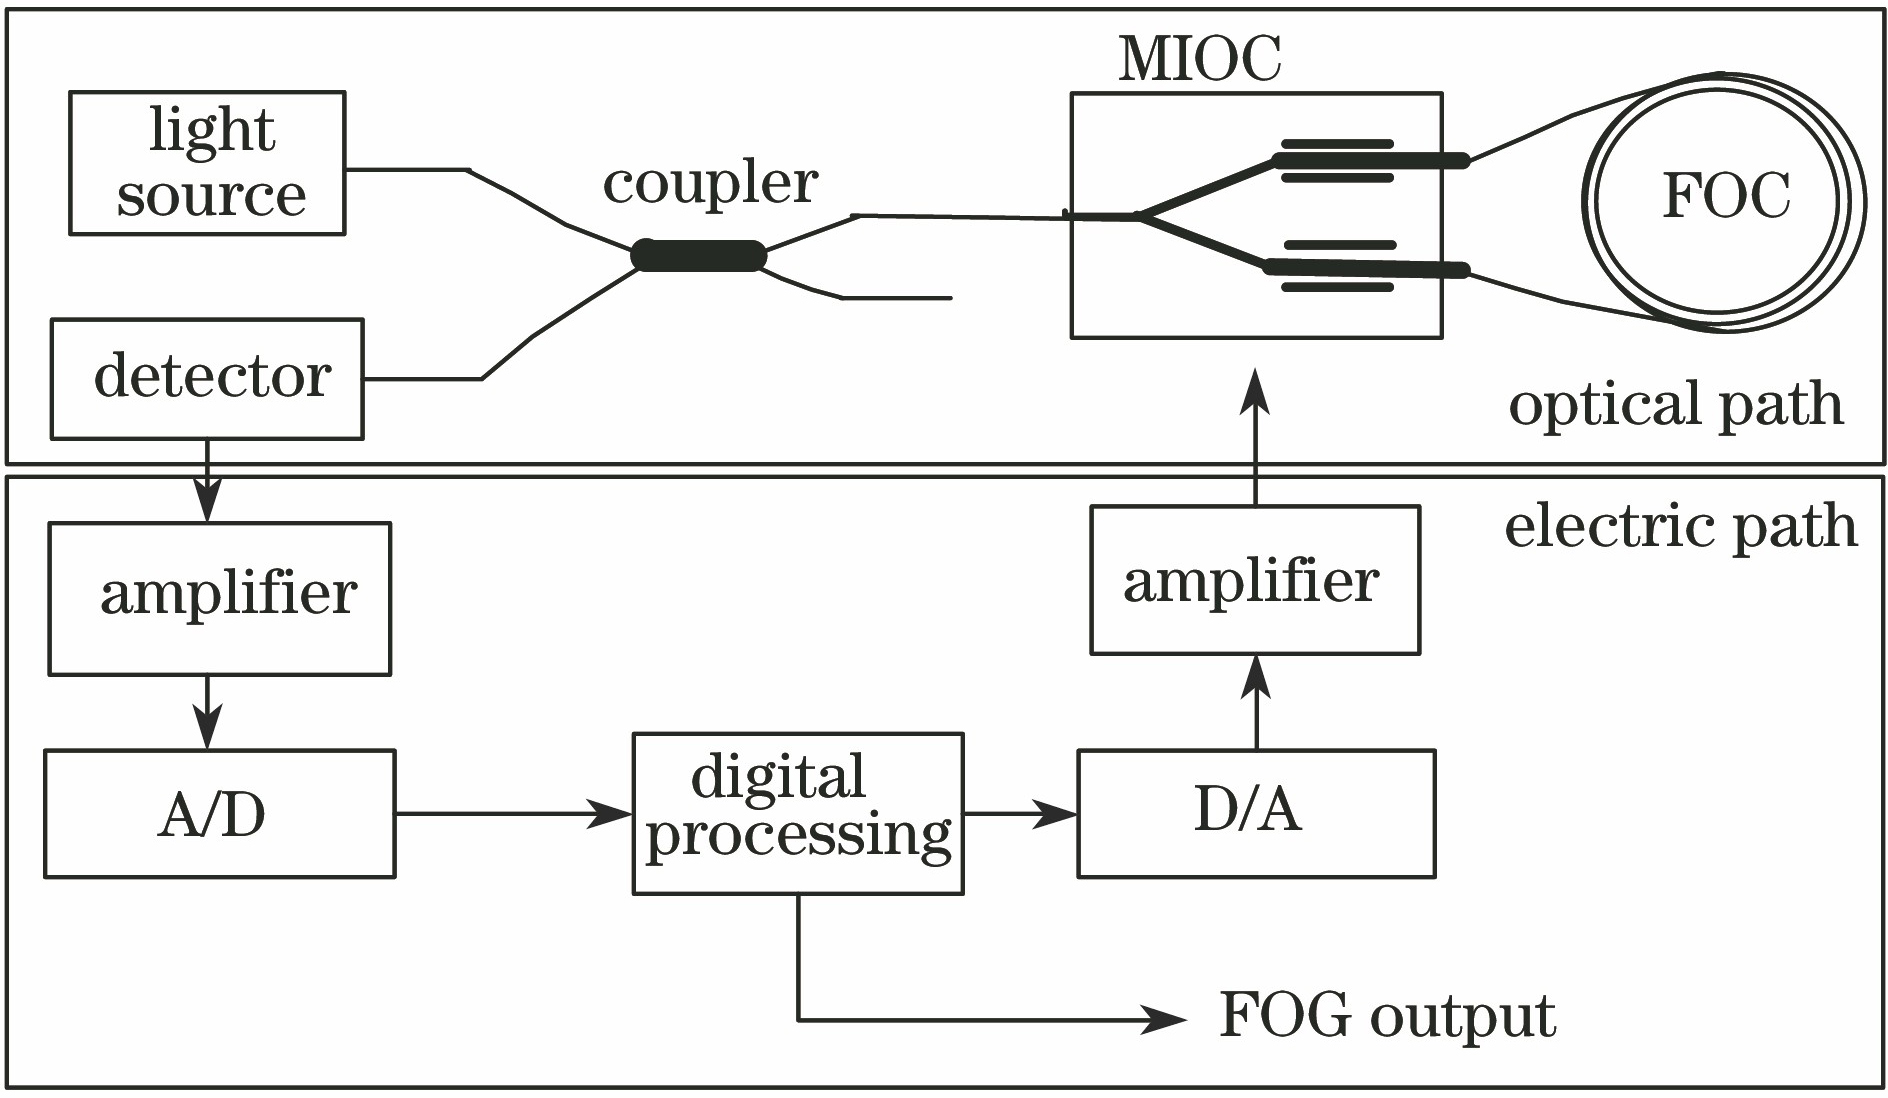
Fig. 1. Basic structural diagram of a close-loop FOG
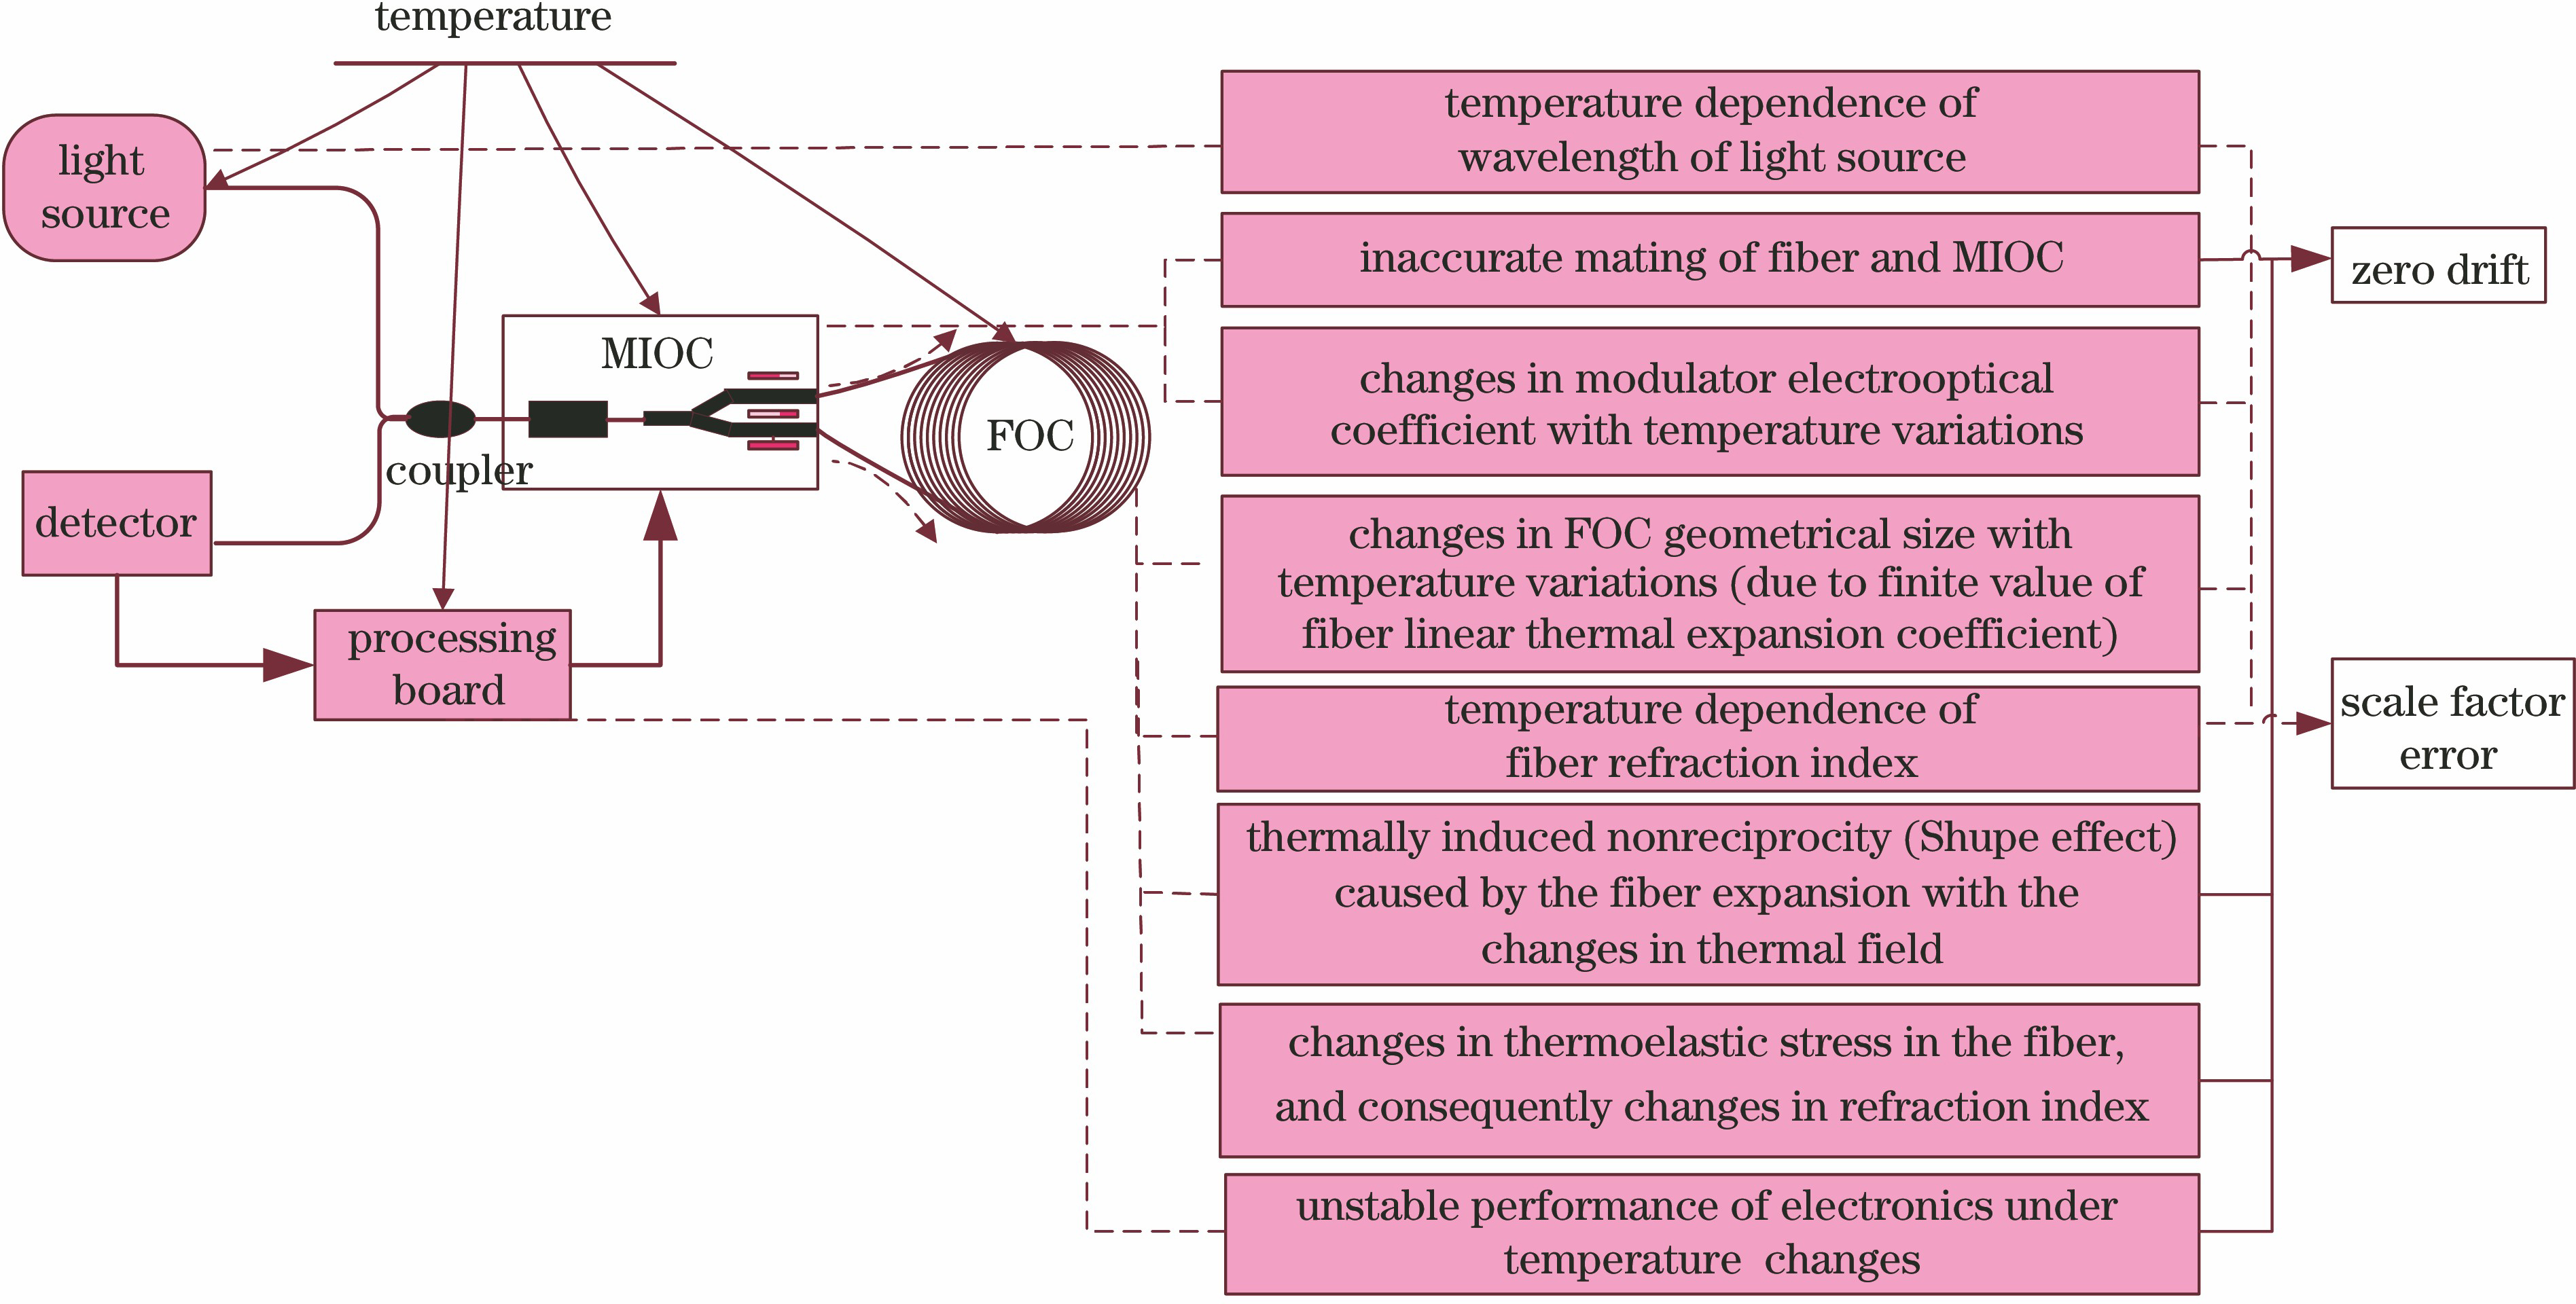
Fig. 2. Principal components and mechanisms of FOG affected by temperatures
Fig. 3. Test curves of FOG under environments 1 and 2. (a) Test environment 1; (b) test environment 2
Fig. 4. Forms of Fourier transform
Fig. 5. Results of Fourier transform of FOG under environments 1 and 2. (a) Test environment 1; (b) test environment 2
Fig. 6. FOG test curves and Fourier transform results under environments 3 and 4. (a) Test curves under test environment 3; (b) test curves under test environment 4; (c) Fourier transform result under test environment 3; (d) Fourier transform result under test environment 4
Fig. 7. Test curves and Fourier transform results of pulsed FOG under environments 3 and 4. (a) Test curves under test environment 3; (b) test curves under test environment 4; (c) Fourier transform result under test environment 3; (d) Fourier transform result under test environment 4
|
Table 1. Comparison of test results of FOG under environments 1 and 2
|
Table 2. Comparison of mean value and standard deviation about frequency spectrum of FOG under environments 1 and 2
|
Table 3. Comparison of test results of FOG under environments 3 and 4
|
Table 4. Comparison of mean value and standard deviation about frequency spectrum of FOG under environments 3 and 4
|
Table 5. Comparison of test results of pulsed FOG under environments 3 and 4
|
Table 6. Comparison of mean value and standard deviation about frequency spectrum of pulsed FOG under environments 3 and 4

Set citation alerts for the article
Please enter your email address
© Copyright 2018-2021 | Chinese Laser Press. All Rights Reserved 沪ICP备15018463号-20