• Chinese Optics Letters
  • Vol. 15, Issue 11, 111101 (2017)
Weizhen He1, Yunhao Zhu1, Ting Feng2, Jie Yuan1、*, Qian Cheng3, Guan Xu4, and Xueding Wang3、4
Author Affiliations
  • 1School of Electronic Science and Engineering, Nanjing University, Nanjing 210046, China
  • 2School of Electronic and Optical Engineering, Nanjing University of Science and Technology, Nanjing 210094, China
  • 3Department of Physics, Tongji University, Shanghai 200092, China
  • 4Department of Radiology, University of Michigan, Ann Arbor, MI 48109, USA
  • show less
    DOI: 10.3788/COL201715.111101 Cite this Article Set citation alerts
    Weizhen He, Yunhao Zhu, Ting Feng, Jie Yuan, Qian Cheng, Guan Xu, Xueding Wang. Comparison study of photoacoustic and ultrasound spectrum analysis in osteoporosis detection[J]. Chinese Optics Letters, 2017, 15(11): 111101 Copy Citation Text show less
    (a)–(c) Image of the micro-CT of osteoporosis, normal, and enhanced bone sample, respectively. (d) The position of the sensors in simulation. A and A1 are a group, B and B1 are another group, and so on. (Ost represents for the osteoporosis bone, Nor represents for the normal bone, and Enh stands for the enhanced bone.)
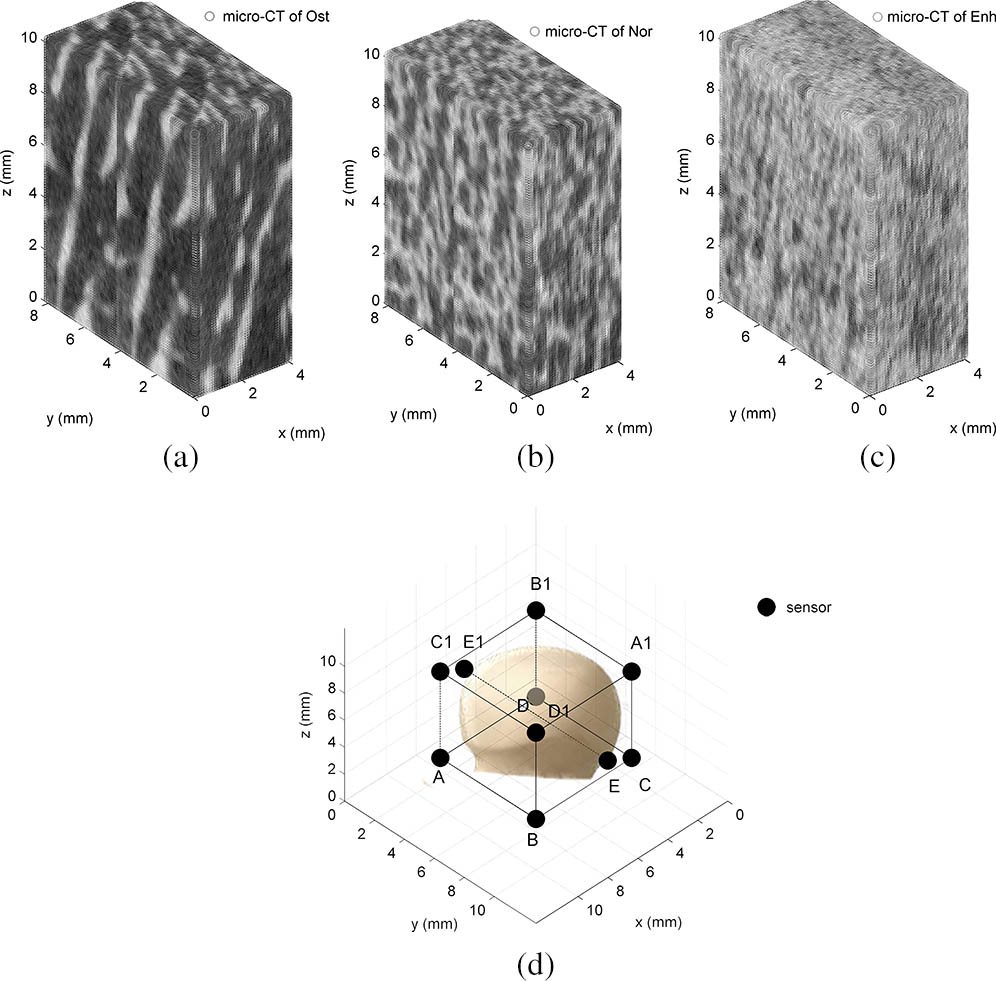
    Fig. 1. (a)–(c) Image of the micro-CT of osteoporosis, normal, and enhanced bone sample, respectively. (d) The position of the sensors in simulation. A and A1 are a group, B and B1 are another group, and so on. (Ost represents for the osteoporosis bone, Nor represents for the normal bone, and Enh stands for the enhanced bone.)
    (Color online) (a) Normalized PA power spectrum density and linear fit of PA signal from three types of bone with different bone microstructures. (b) Normalized QUS power spectrum density and their linear fit. (c) The PA experiment spectrum. (d) The US experiment spectrum. (e) The box plot of the slope of three PA spectra and BUA from the QUS spectra. (f) The value of three PA spectral slopes versus the mean BUA of the QUS.
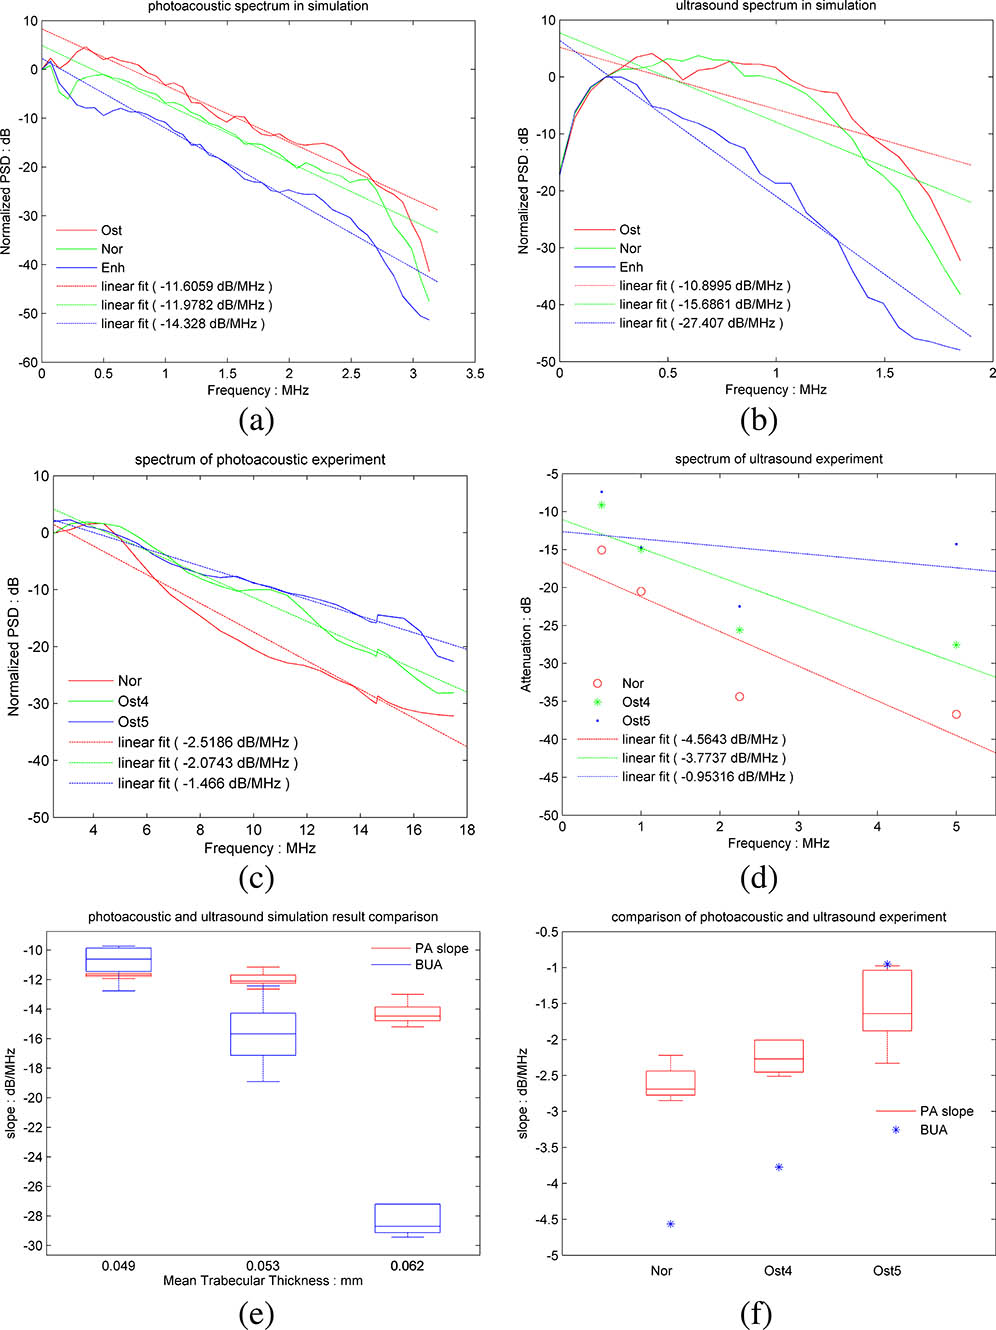
    Fig. 2. (Color online) (a) Normalized PA power spectrum density and linear fit of PA signal from three types of bone with different bone microstructures. (b) Normalized QUS power spectrum density and their linear fit. (c) The PA experiment spectrum. (d) The US experiment spectrum. (e) The box plot of the slope of three PA spectra and BUA from the QUS spectra. (f) The value of three PA spectral slopes versus the mean BUA of the QUS.
    (Color online) Normalized PA spectral parameter slope of four groups of samples. Ost1, Ost2, and Ost3 are bone samples taken as a corrosion matrix in proper order based on the normal bone.
    Fig. 3. (Color online) Normalized PA spectral parameter slope of four groups of samples. Ost1, Ost2, and Ost3 are bone samples taken as a corrosion matrix in proper order based on the normal bone.
    (a) Experiment setup for studying the PAs in a femur. (b) The photo of the PA experiment setup. (c) The sample of the experiment.
    Fig. 4. (a) Experiment setup for studying the PAs in a femur. (b) The photo of the PA experiment setup. (c) The sample of the experiment.
    Weizhen He, Yunhao Zhu, Ting Feng, Jie Yuan, Qian Cheng, Guan Xu, Xueding Wang. Comparison study of photoacoustic and ultrasound spectrum analysis in osteoporosis detection[J]. Chinese Optics Letters, 2017, 15(11): 111101
    Download Citation