Weizhen He, Yunhao Zhu, Ting Feng, Jie Yuan, Qian Cheng, Guan Xu, Xueding Wang. Comparison study of photoacoustic and ultrasound spectrum analysis in osteoporosis detection[J]. Chinese Optics Letters, 2017, 15(11): 111101
Copy Citation Text
Osteoporosis is a progressive bone disease, which is characterized by a decrease in the bone mass and deterioration in bone micro-architecture. In theory, photoacoustic (PA) analysis has the potential to obtain the characteristics of the bone effectively. In this study, we try to compare the PA spectral analysis (PASA) method with the quantitative ultrasound (QUS) method in osteoporosis assessment. We compare the quantified parameter slope from the PASA and broadband ultrasound attenuation from QUS among different bone models, respectively. Both the simulation and ex vivo experiment results show that bone with lower bone mineral density has the higher slope in the PASA method. Our comparison study proves that the PASA method has the same efficiency as QUS in osteoporosis assessment.
Osteoporosis is a generalized skeletal disorder characterized with compromised bone strength and deterioration of bone quality, often leading to fragility fractures[1]. It increases the risk of a broken bone and is the most common reason for fractures in the elderly. In osteoporosis, the bone mineral density (BMD) is reduced, which provides the main evaluation factor in clinical diagnosis for osteoporosis. Other symptoms include the variety of proteins in bone and the micro-architecture deterioration.
Normally, osteoporosis is diagnosed graphically using dual energy X-ray absorptiometry (DEXA) assessment[2,3], which is considered the gold standard for the diagnosis of osteoporosis. It can explain 60%–80% of the variability in bone strength[4]. While other mechanical factors, including micro-architecture and post yield mechanical properties, are also important in determining the fracture risk of bone[5,6], bone strength cannot be tested by DEXA. In addition to DEXA, computed tomography (CT) and magnetic resonance imaging (MRI) are also useful to osteoporosis detection. However, these methods are relatively insensitive to detection of early disease and require a substantial amount of bone loss to be apparent on images. Nonionizing and noninvasive quantitative ultrasound (QUS) technology provides a practical alternative for the radiography methods mentioned before. This method has been developed and introduced in recent years for the assessment of skeletal status[7–11]. Both cross-sectional and prospective studies have demonstrated close association between QUS parameters and osteoporotic status[12–15]. QUS is an acceptable, low-cost, and readily accessible alternative to DEXA measurements of BMD in the osteoporosis diagnosis. Different QUS devices are quite different in terms of the parameters they measure. QUS techniques are safe, easy to use, and radiation-free. It has been claimed that QUS may permit an assessment of bone microstructure and provide new ways for assessing information relevant to bone fragility, which currently is inaccessible by bone densitometry techniques. Broadband ultrasound attenuation (BUA) and speed of sound (SOS) are two important parameters in the QUS assessment of bone structure[16].
Photoacoustic (PA) imaging, a biomedical imaging modality based on the PA effect, combines the sensitivity and contrast of optical imaging with the depth and resolution of an ultrasound (US). It has potential in osteoporosis detection because PAs reflect the optical absorption ability of tissue and detects composition variation more effectively than other methods. Several studies have been explored for potential application in bone mass diagnosis in recent years[17–19]. However, these studies only focus on the analysis of the time-domain signal and chemical components change. There is no thorough research exploring the feasibility of the PA spectrum in evaluating osteoporosis, and also no comparison study has been done between PAs and QUS yet. It has been proved that the frequency domain power distribution of the radio frequency PA signal contains information representative of histological microstructures in biological samples[20–22], and the ability to characterize the microstructures of the PA spectral analysis (PASA) has been proved[23–25].
Sign up for Chinese Optics Letters TOC. Get the latest issue of Chinese Optics Letters delivered right to you!Sign up now
In this Letter, we study the feasibility of PASA in osteoporosis detection of trabecular bone by comparing the result of PASA with that of QUS through evaluating the criterion parameters. Both the simulation study and ex vivo study are conducted on a three-dimensional (3D) rat femur bone, since the 3D study is closer to the real situation and can reflect the anisotropy of bone better. Our study tries to prove that PASA could be a standard in osteoporosis detection as a QUS.
DEXA and quantitative CT (QCT) define osteoporosis by measuring the bone density. Both of them are quantitative methods characterized as high-cost, radiative, and non-portable. Furthermore, evidence shows that the DEXA and QCT standard is usually used in the spine, hip, and forearm, but other parts like the wrist and femur are not totally corrected[26–29].
PA signals can reflect the light absorbing ability of the targeting material. PASA is a method based on the calculating the power spectrum of the time-domain PA signal[30]. In PASA, slope, mid-band fit, and interception are used to characterize biomedical tissue. Among these parameters, slope is sensitive to the tissue heterogeneity, where it can better reflect the microstructure change and the spatial distributions of the optical absorbing chemical components in the trabecular bone. Moreover, slope is less affected by the light variation, so it is more reliable for objective tissue characterization[31].
Biomedical PA signals propagate according to the acoustic wave equation shown below; where , , , are the SOS in biomedical tissue, constant pressure heat capacity, coefficient of thermal expansion, and heat source function, respectively. is the vector of the detection transducer. denotes the pressure of sound received by the US transducer:
Here, is the optical absorption function in tissue, is light source function. According to the Green function, the solution of Eq. (1) can be expressed as where is observation vector. The equation above can be written in the frequency domain as where is the wave number, and . is the distance from observation point to the organization. V is the space of the PA sources. The power spectrum is defined as where is the US transducer frequency response function, and the asterisk denotes the complex conjugate. Substituting Eq. (4) into Eq. (5), we can get where and are used to describe the light absorption and US transducer directivity function. Taking the logarithm to the Eq. (6), we can get
Equation (7) clearly shows that the PA spectrum is influenced by the following indexes: laser incident energy, the gain of the system, directivity of the transducer, and the spatial distribution of the optical absorption coefficient. Osteoporosis leads to the change of the bone microstructure. With the change of the bone microstructure, the bone masses lose, and the absorption of optics becomes weak. In the next section, we will reveal that the downhill trend of the PA spectrum is alleviated with the rising osteoporosis degree, which infers that the spectrum of the PA holds the potential for osteoporosis detection.
The attenuation of acoustic signal can be expressed as where is the decayed intensity in the distance of , is the incident acoustic wave intensity, and is the attenuation coefficient related to the sound frequency.
To measure the attenuation coefficient in bone, we first measure the spectrum of the acoustic signal in water recorded as , while the spectrum through the bone sample is denoted as . The transfer function is defined as
Taking the logarithm of the equation above, we can get
Taking on the Taylor expansion and reserving the constant and primary terms[32,33], we can get where the BUA is defined as the unit attenuation, and is a constant. The BUA is defined as , so the acoustic decay curve of the US can be presented as
From Eq. (12), we can find that BUA is the slope of the decay spectrum. The microstructure of bone mainly contains the trabecular separation, the trabecular connection, and the number of trabecular. Our former study had proved that BUA is largely influenced by both trabecular separation and connection[34]. Since the change of bone microstructure leads to osteoporosis, and the parameter BUA is closely related to the main influencing factors of the microstructure, therefore, the BUA can reflect the bone mass change and reveal the degree of osteoporosis.
A simulations study of PASA and QUS are conducted using k-Wave Toolbox, software designed for time-domain acoustic and US simulations in complex and tissue-realistic media. The computation of acoustic press is based on the k-space pseudo-spectral method[35], which uses an exact time propagator to calculate the acoustic field and a leapfrog finite-difference scheme to integrate forward in time. Each spatial gradient is computed locally based on the function value at neighboring grid points. This method also applies a boundary layer called a perfectly matched layer in order to prevent waves that leave one side of the domain being reintroduced from the opposite side. This allows infinite domain simulations to be computed using small computational grids. Calculating at each grid by order, we can finally get the acoustic press at the sensor position.
Welch spectrum estimation is used to calculate the spectrum. The PA and QUS spectras are both calculated by this method. It is a method with improvement on the period gram spectrum estimation[36] and adopts a modified version of the Bartlett method, in which the portion of the series contributing to each period gram can overlap[37].
As for QUS, we first get the acoustic signal without the bone sample to eliminate the influence of the sensor; then, we get the acoustic signal with the bone sample. After calculating the two US spectra, we subtract the acoustic spectrum of the water from the acoustic spectrum of the bone sample, and the decay curve is then obtained. Since the high frequency attenuates are too serious to be useful in spectrum calculation, we intercept the frequency under 5 MHz to calculate the BUA parameter.
To evaluate the feasibility of PASA in detecting osteoporosis, we carry out two simulations. The first simulation is based on three types of rat femur bones scanned by micro-CT. The first type is an osteoporosis bone, and the second one is a normal bone, while the last one is an enhanced bone. The second simulation is based on the normal bone in the first simulation corroded for three times, respectively.
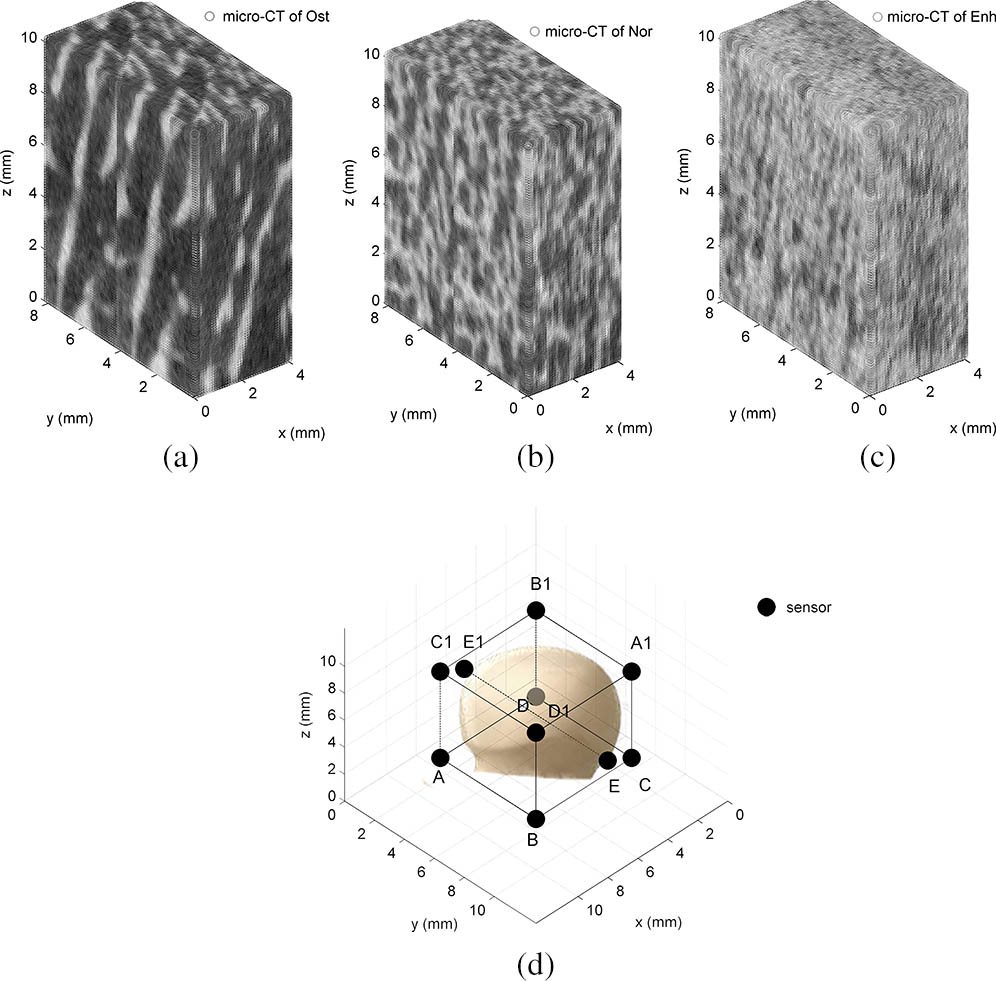
In our simulation, we make a 3D bone sample in a grid, and each grid is 0.1 mm in length. Then, we set the density and acoustic speed according to the samples. The optical absorption coefficient and the optical attenuation coefficient are set as constant at 0.5 and 0.1 in the simulation. The initial pressure of sound is set up as constant 1 in the simulation. In the simulation, the SOS and density are and in cancellous bone, while in trabecular bone, the parameters are and , respectively[38]. We set 10 different positioned sensors in 10 simulations. The positions of the sensor and bone type are shown blow in Fig. 1. The bone sample is placed in the middle of the grid. The sensor records the acoustic pressure. The center frequency of the sensor is 20 MHz, and the bandwidth of the sensor is the 200th percentage of the center frequency. These parameters are totally the same in the two simulations. We repeat 10 groups of samples using the function in k-Wave Toolbox. The parameter of slope is calculated after the spectral normalization.
Figure 1.(a)–(c) Image of the micro-CT of osteoporosis, normal, and enhanced bone sample, respectively. (d) The position of the sensors in simulation. A and A1 are a group, B and B1 are another group, and so on. (Ost represents for the osteoporosis bone, Nor represents for the normal bone, and Enh stands for the enhanced bone.)
With 10 groups of spectra, we calculate their averaged slopes and compare the variation trend with corresponding BUAs and the results of the PASA are presented in Fig. 2. Spectra with different bone mass are compared by the spectrum parameter slope, which is relevant to the mean trabecular thickness (MTT). The main property of osteoporosis is the changing of the physical structure, and the MTT is the major reflection of the structure changing. The conclusion is the more serious the bone loss is the slope of the PA spectrum becomes higher, which meets our expectation.
Figure 2.(Color online) (a) Normalized PA power spectrum density and linear fit of PA signal from three types of bone with different bone microstructures. (b) Normalized QUS power spectrum density and their linear fit. (c) The PA experiment spectrum. (d) The US experiment spectrum. (e) The box plot of the slope of three PA spectra and BUA from the QUS spectra. (f) The value of three PA spectral slopes versus the mean BUA of the QUS.
The result of the BUA in the first simulation is also demonstrated in Fig. 2. This simulation verified the fact that as the bone loss becomes serious, the BUA becomes higher. The three slopes of the PA spectral are showed in Fig. 2(a), and they are , , and , respectively. The maximum slope of the three groups’ spectra divided by the minimum slope is 1.23. While the same contrast ratio in the BUA is 2.51, three BUA values are displayed in Fig. 2(b), where the values are , , and . The comparison trend can be observed in Fig. 2(e). In the figure, we can see that the slopes of the PA spectrum have the same changing trend as the BUA does, which proves that both QUS and PASA can detect the structure change of the bone. Furthermore, the error bar and boxplot show that the fluctuation of the slope of the PA is much smaller than the BUA, which means better consistency.
Since the bone samples in the first simulation consist of only one group of osteoporosis type, it can only explain that the change of microstructure in bone could be reflected by the slope of the PA spectrum. The second simulation included four groups of bone, three of which are with different bone loss in this simulation. The mean thickness is quantified following the mean trabecular plate thickness method[39]. As we can see in Fig. 3, the slope of the PA spectrum becomes higher with the osteoporosis’s degree enhanced. With these two simulations, we may draw the conclusion that PASA could be a standard in osteoporosis detection.
Figure 3.(Color online) Normalized PA spectral parameter slope of four groups of samples. Ost1, Ost2, and Ost3 are bone samples taken as a corrosion matrix in proper order based on the normal bone.
As for our ex vivo experiment, we use a sliced bovine femur. The thicknesses of the sliced pieces are all around 3 mm. The experiment bone samples are shown in Fig. 4(c). There are five pieces of bones for averaging in this ex vivo experiment. At the beginning, these bones are measured without any treatment. Then, they are soaked in the ethylene diamine tetra acetic acid (EDTA) for one day, and then another day. We do this to make sure that the bone mass has loss and simulate the osteoporosis circumstance. Figure 4(b) indicates the instrument of our experiment. We use an optical parametric oscillator (OPO) system (Vibrant B, Opotek) pumped by an Nd:YAG laser (Brilliant B, Bigsky) to provide laser pulses with a repetition rate at 10 Hz and a pulse width of 5.5 ns. The laser beams with 2 mm in diameter illuminating the bone surface generate PA signals that are received by a 20 MHz focused transducer (Hydrophone N, Onda). Working at a 685 nm wavelength, the light’s fluency on the bone surface is within the American National Standards Institute (ANSI) safety limit. The US receiving sensor is right towards the middle of the bone specimen to minimize the influence of the cortical signal. In this way, the signals received by the transducer are almost coming from trabecular bone. The PA signals are recorded by a digital oscilloscope (TDS 540B, Tektronics).
Figure 4.(a) Experiment setup for studying the PAs in a femur. (b) The photo of the PA experiment setup. (c) The sample of the experiment.
The experiment setup is shown in Fig. 4(a). In our study, we try to prevent useless signals and only focus on the signal of the trabecular bone. As the front and back signal includes only a little information of the microstructure, it has interference for the calculation of the spectrum. After getting the signal, we delete the bone mass signal from frontier and the behind, and chose the middle of the signal to calculate the spectrum. The averaged PA spectra of three groups of PA are shown in Fig. 2(c). The three groups are the normal group, the group corroded for one day (Ost4), and the group corroded for two days (Ost5). Their slopes are , , and , respectively. As the receiving sensor we use is not a broadband transmitter, we measure the BUA using emissive frequency at 0.5, 1, 2.25, and 5 MHz, respectively. By averaging the five groups, we make a linear fit to these data. The averaged BUA of the QUS spectrum shown in Fig. 2(d) is , , and , respectively. According to the comparison in Fig. 2(f), we can get the conclusion that the more serious the bone mass loss (the thinner MTT), the higher the slope value the PA spectrum has, which is identical with the conclusion of our simulation.
We aim at studying the feasibility of PASA for osteoporosis. The possibility of osteoporosis detection by PASA is studied by theory at first. By comparing the changing trend of slope in the spectrum of PA and US in different bone mass, respectively, we get the conclusion that PASA has the same effects as QUS in the bone characterization of bone. To further confirm whether PASA can detect osteoporosis, we conduct the second simulation and experiment, in which each bone type has osteoporosis to a different degree. Combining the experiment and the simulation, we draw the conclusion that PASA can become a method in osteoporosis detection.
The QUS mainly reflects the attenuation in bone, while the PASA mainly reflects the change of optical distribution. So, the two slopes have different physical meaning in nature. Although US has a better contrast ratio than PAs in detecting osteoporosis, the PAs have the same tendency as the US in detecting osteoporosis with better consistency. Besides, considering the advantages of PA measurement, including non-ionizing, non-invasive, and sufficient penetration in both calcified and non-calcified tissues, PASA clearly holds potential for clinical evaluation for osteoporosis.
Further study still needs to be done in the future. For instance, the simulation type does not include the cortical bone part, because this kind of bone forms an extremely hard exterior of bones and makes the strength of signal attenuating serious[40]. In the experiment, we also put the laser beam straight forward to the center of trabecular bone for the sake of forbidding the influence of cortical bone. But in the actual situation, the cortical part should be taken into consideration. To solve this problem, we should try to enhance the penetrating power of PAs in the future. We should also optimize the model in the simulation, because the acoustic spread through the bone is complicated, and the simulation model cannot completely reflect the actual situation.
For future clinical attempts, PASA could combine other methods, such as QUS, to achieve dual measurement of the bone condition. The slope of BUA quantified in QUS mainly reflects the attenuation along with the frequency, while the slope of PA in PASA mainly reflects the optical absorption distribution and microstructure change. Unlike US, the PA signal is not produced by a transmitter probe but by a laser. The frequency components of the PAs are mainly determined by the bone structure distribution. Thus, we can draw the conclusion that the PA signal carries richer information than the US signal does. In the future, the PASA of bone can be implemented inexpensively by using high-power laser diodes, which have already been adapted to biomedical PA imaging and sensing[41]. Yhe combination of PASA and QUS can make the clinical diagnosis of bone conditions much more accurate.
References
[1] R. Florence, S. Allen, L. Benedict, R. Compo, A. Jensen, D. Kalogeropoulou, A. Kearns, S. L. Arson, E. Mallen, K. O’Day, A. Peltier, B. Webb. Inst. Cl Sys. Improve, 87, 189(2013).