
G. Pérez-Callejo, V. Bouffetier, L. Ceurvorst, T. Goudal, S. R. Klein, D. Svyatskiy, M. Holec, P. Perez-Martin, K. Falk, A. Casner, T. E. Weber, G. Kagan, M. P. Valdivia. Phase imaging of irradiated foils at the OMEGA EP facility using phase-stepping X-ray Talbot–Lau deflectometry[J]. High Power Laser Science and Engineering, 2023, 11(4): 04000e49
- High Power Laser Science and Engineering
- Vol. 11, Issue 4, 04000e49 (2023)
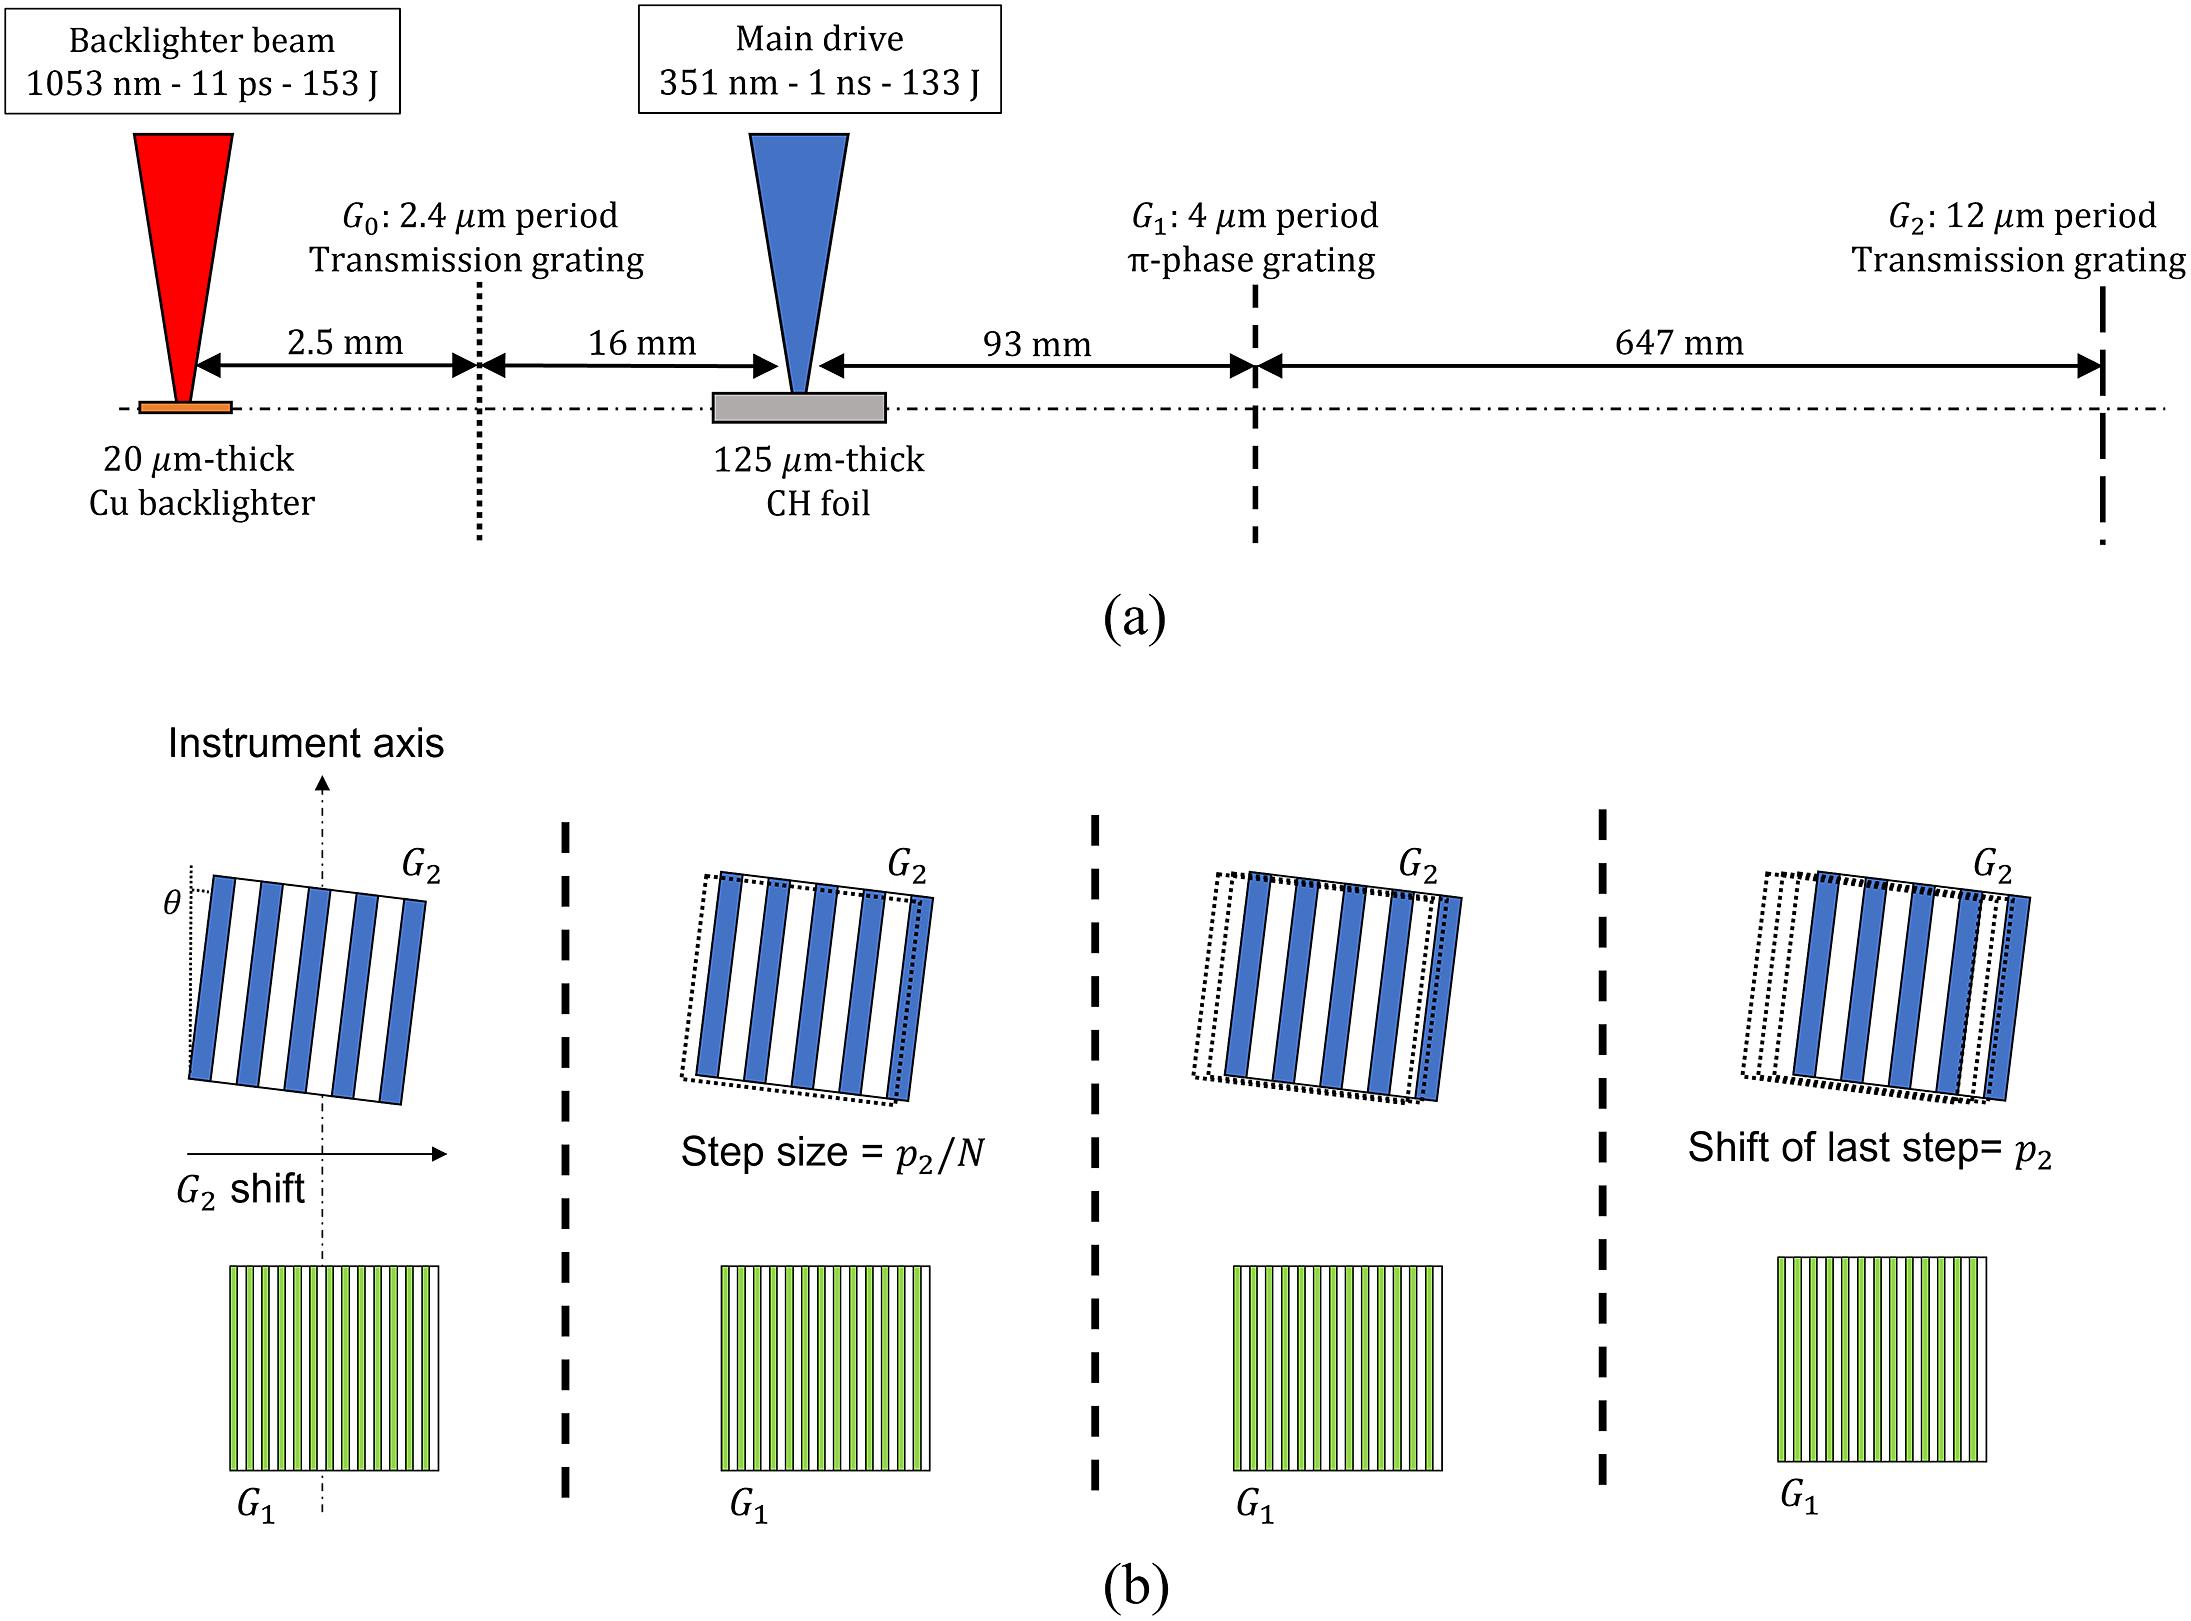
Fig. 1. (a) Schematic drawing of the experimental setup. The figure shows the different elements of the interferometer together with the backlighter target, the plasma target and the corresponding laser beams. In this figure,  corresponds to the source grating,
  is the beamsplitter and
  is the analyzer grating described in the text. The dot-dashed line across all elements corresponds to the optical axis of the interferometer. Note that the distances indicated between the different elements are not to scale. (b) Schematic drawing describing how the phase-stepping procedure works. The
  grating is displaced perpendicular to the instrument axis and grating bars, scanning over one full grating period
  (
( ) after
  steps. In this schematic, only four steps in a period are shown and the rotation angle of
  with respect to
  has been exaggerated for clarity (in our experimental setup, this angle was
  ).
).
corresponds to the source grating, is the beamsplitter and is the analyzer grating described in the text. The dot-dashed line across all elements corresponds to the optical axis of the interferometer. Note that the distances indicated between the different elements are not to scale. (b) Schematic drawing describing how the phase-stepping procedure works. The grating is displaced perpendicular to the instrument axis and grating bars, scanning over one full grating period () after steps. In this schematic, only four steps in a period are shown and the rotation angle of with respect to has been exaggerated for clarity (in our experimental setup, this angle was ). 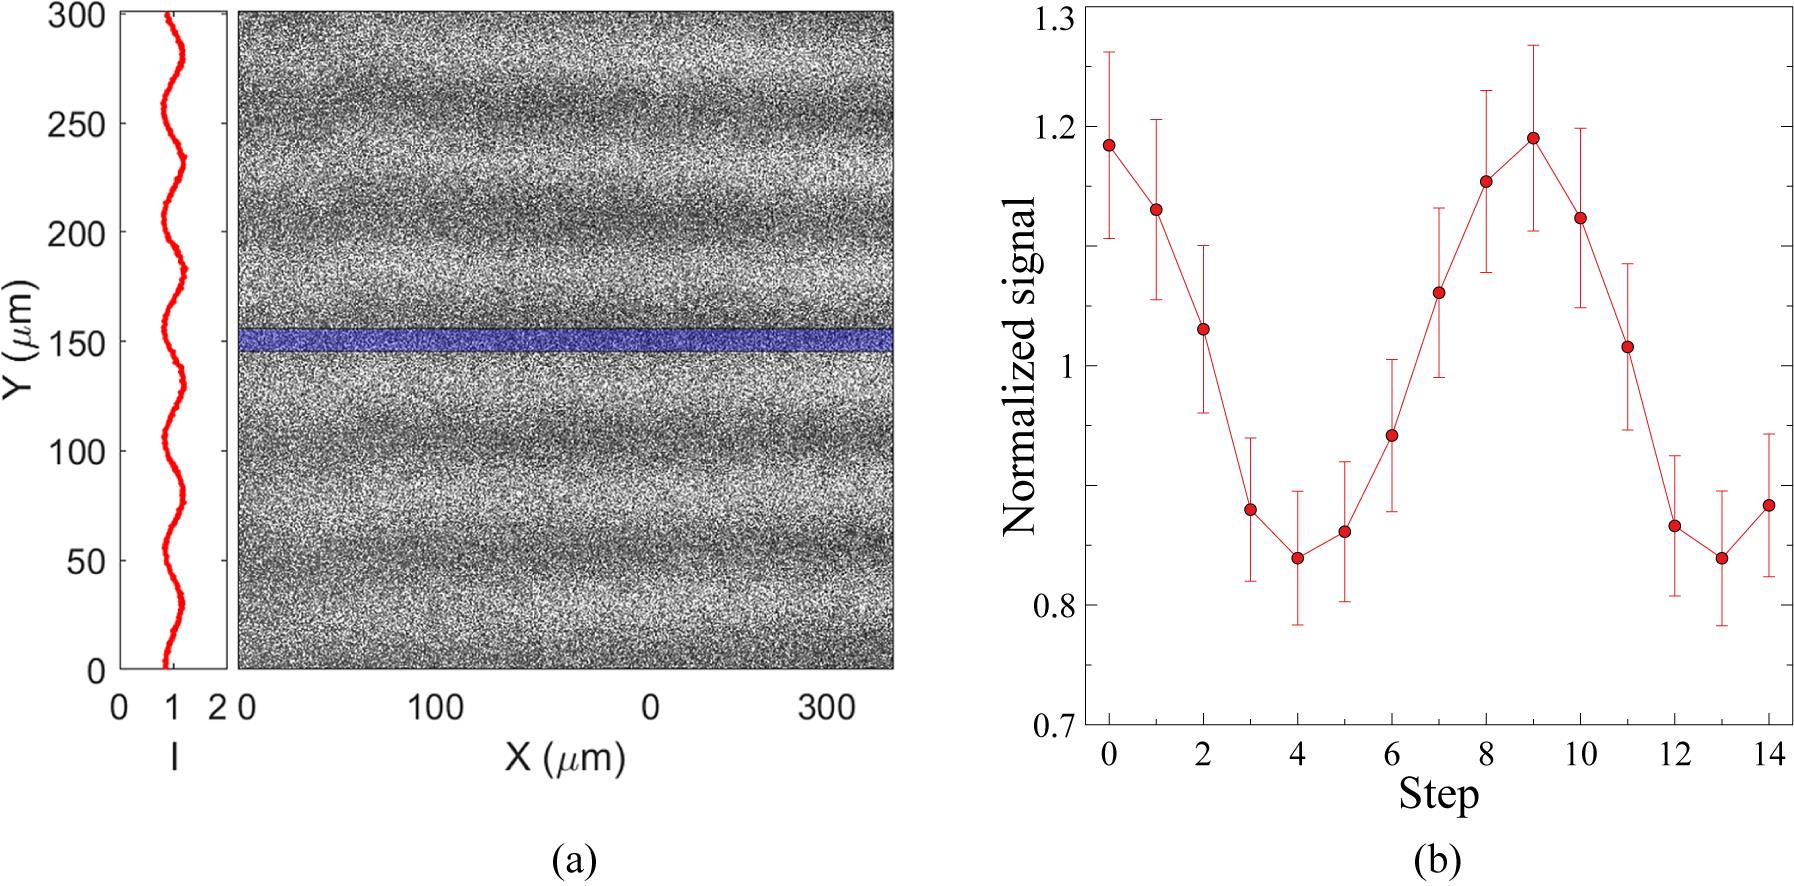
Fig. 2. (a) Example of ex situ reference images recorded for phase-stepping. The Moiré fringes are oriented horizontally. The red line shows the average normalized fringe profile, corresponding to a contrast of approximately 20%. (b) Normalized intensity phase curve corresponding to all phase-stepping reference images. The so-called phase-stepping contrast (contrast of the phase-stepping features) is 20%.
Fig. 3. Interferometry image of the ablated plasma. The dark vertical feature around  corresponds to the CH foil. Note that the direction of the phase-change detection coincides with the Moiré fringes, which are oriented horizontally in our experiment. The region indicated with the red-dashed square corresponds to the field of view of the reference images and, therefore, to the region that was analyzed. The region within the white-dotted square corresponds to the region of consideration, after removing the edges to avoid the Gibbs phenomenon and possible grating imperfections. Similar to
 Figure 2(a) , the fringe profile inside the target is shown on the left-hand side of the image, corresponding to approximately 3% fringe contrast (the contrast outside the target is  ). Note that the contrast plot has been scaled to improve the view.
corresponds to the CH foil. Note that the direction of the phase-change detection coincides with the Moiré fringes, which are oriented horizontally in our experiment. The region indicated with the red-dashed square corresponds to the field of view of the reference images and, therefore, to the region that was analyzed. The region within the white-dotted square corresponds to the region of consideration, after removing the edges to avoid the Gibbs phenomenon and possible grating imperfections. Similar to ). Note that the contrast plot has been scaled to improve the view. Fig. 4. (a) Cropped region from the interferometry data corresponding to the field of view of the reference images (red square in Figure 3 ) after removing the image edges to avoid the Gibbs phenomenon from the Fourier analysis. The  and
and  coordinates correspond to the white-dotted square in
 Figure 3 . (b), (c) Transmission and phase-shift data line-outs, integrated over the region shown in (a). The shaded regions in all images correspond to the original position of the target convoluted with the spatial resolution of the instrument. In (c) the brown dotted line corresponds to the phase shift obtained without applying phase-stepping techniques, while the black dashed line corresponds to the phase shift obtained from the FLASH simulations, by taking the integrated electron density gradient. The vertical dashed lines across all figures correspond to the expanding plasma.
and coordinates correspond to the white-dotted square in 
Set citation alerts for the article
Please enter your email address
© Copyright 2018-2021 | Chinese Laser Press. All Rights Reserved 沪ICP备15018463号-20