
G. Pérez-Callejo, V. Bouffetier, L. Ceurvorst, T. Goudal, S. R. Klein, D. Svyatskiy, M. Holec, P. Perez-Martin, K. Falk, A. Casner, T. E. Weber, G. Kagan, M. P. Valdivia, "Phase imaging of irradiated foils at the OMEGA EP facility using phase-stepping X-ray Talbot–Lau deflectometry," High Power Laser Sci. Eng. 11, 04000e49 (2023)
- High Power Laser Science and Engineering
- Vol. 11, Issue 4, 04000e49 (2023)
Abstract
1 Introduction
Interferometry methods are a very powerful tool for diagnosing plasmas, as they can provide very valuable information about the plasma electron and ion density in a simple manner. However, current diagnostic methods mostly rely on visible radiation and, thus, high energy density (HED) plasma probing is difficult since these plasmas are mostly opaque to visible wavelengths. Considering this, Talbot–Lau interferometry is a promising approach to diagnosing HED plasmas as it extends interferometry methods to the X-ray regime[1].
Talbot–Lau interferometry relies on two different phenomena: the Talbot effect[2] and the Lau effect[3]. The Talbot effect exhibits itself in the fact that when a coherent wave is diffracted by a periodic grating, an exact replica of the grating is observed at a distance
Since most laboratory X-ray sources are incoherent per se, as is the case for laser-produced X-ray sources, they cannot be used directly to generate an interference pattern. However, a series of smaller and locally coherent sources can be generated through the Lau effect by placing an additional diffraction grating between the source and the interferometer. Under the right conditions, this so-called source grating can generate an interference pattern[4].
Sign up for High Power Laser Science and Engineering TOC. Get the latest issue of High Power Laser Science and Engineering delivered right to you!Sign up now
These two effects are combined in a Talbot–Lau interferometer as follows. After the backlighter, the first diffraction grating (the source grating) is placed in front of the interferometer to generate locally coherent sources from the probing radiation. The object to be probed is often placed next, so that it imprints a phase pattern on the incoming radiation. This is then diffracted by a second grating called the beamsplitter or phase grating. The diffraction pattern that is generated is finally filtered by a third grating called the analyzer, placed at a distance
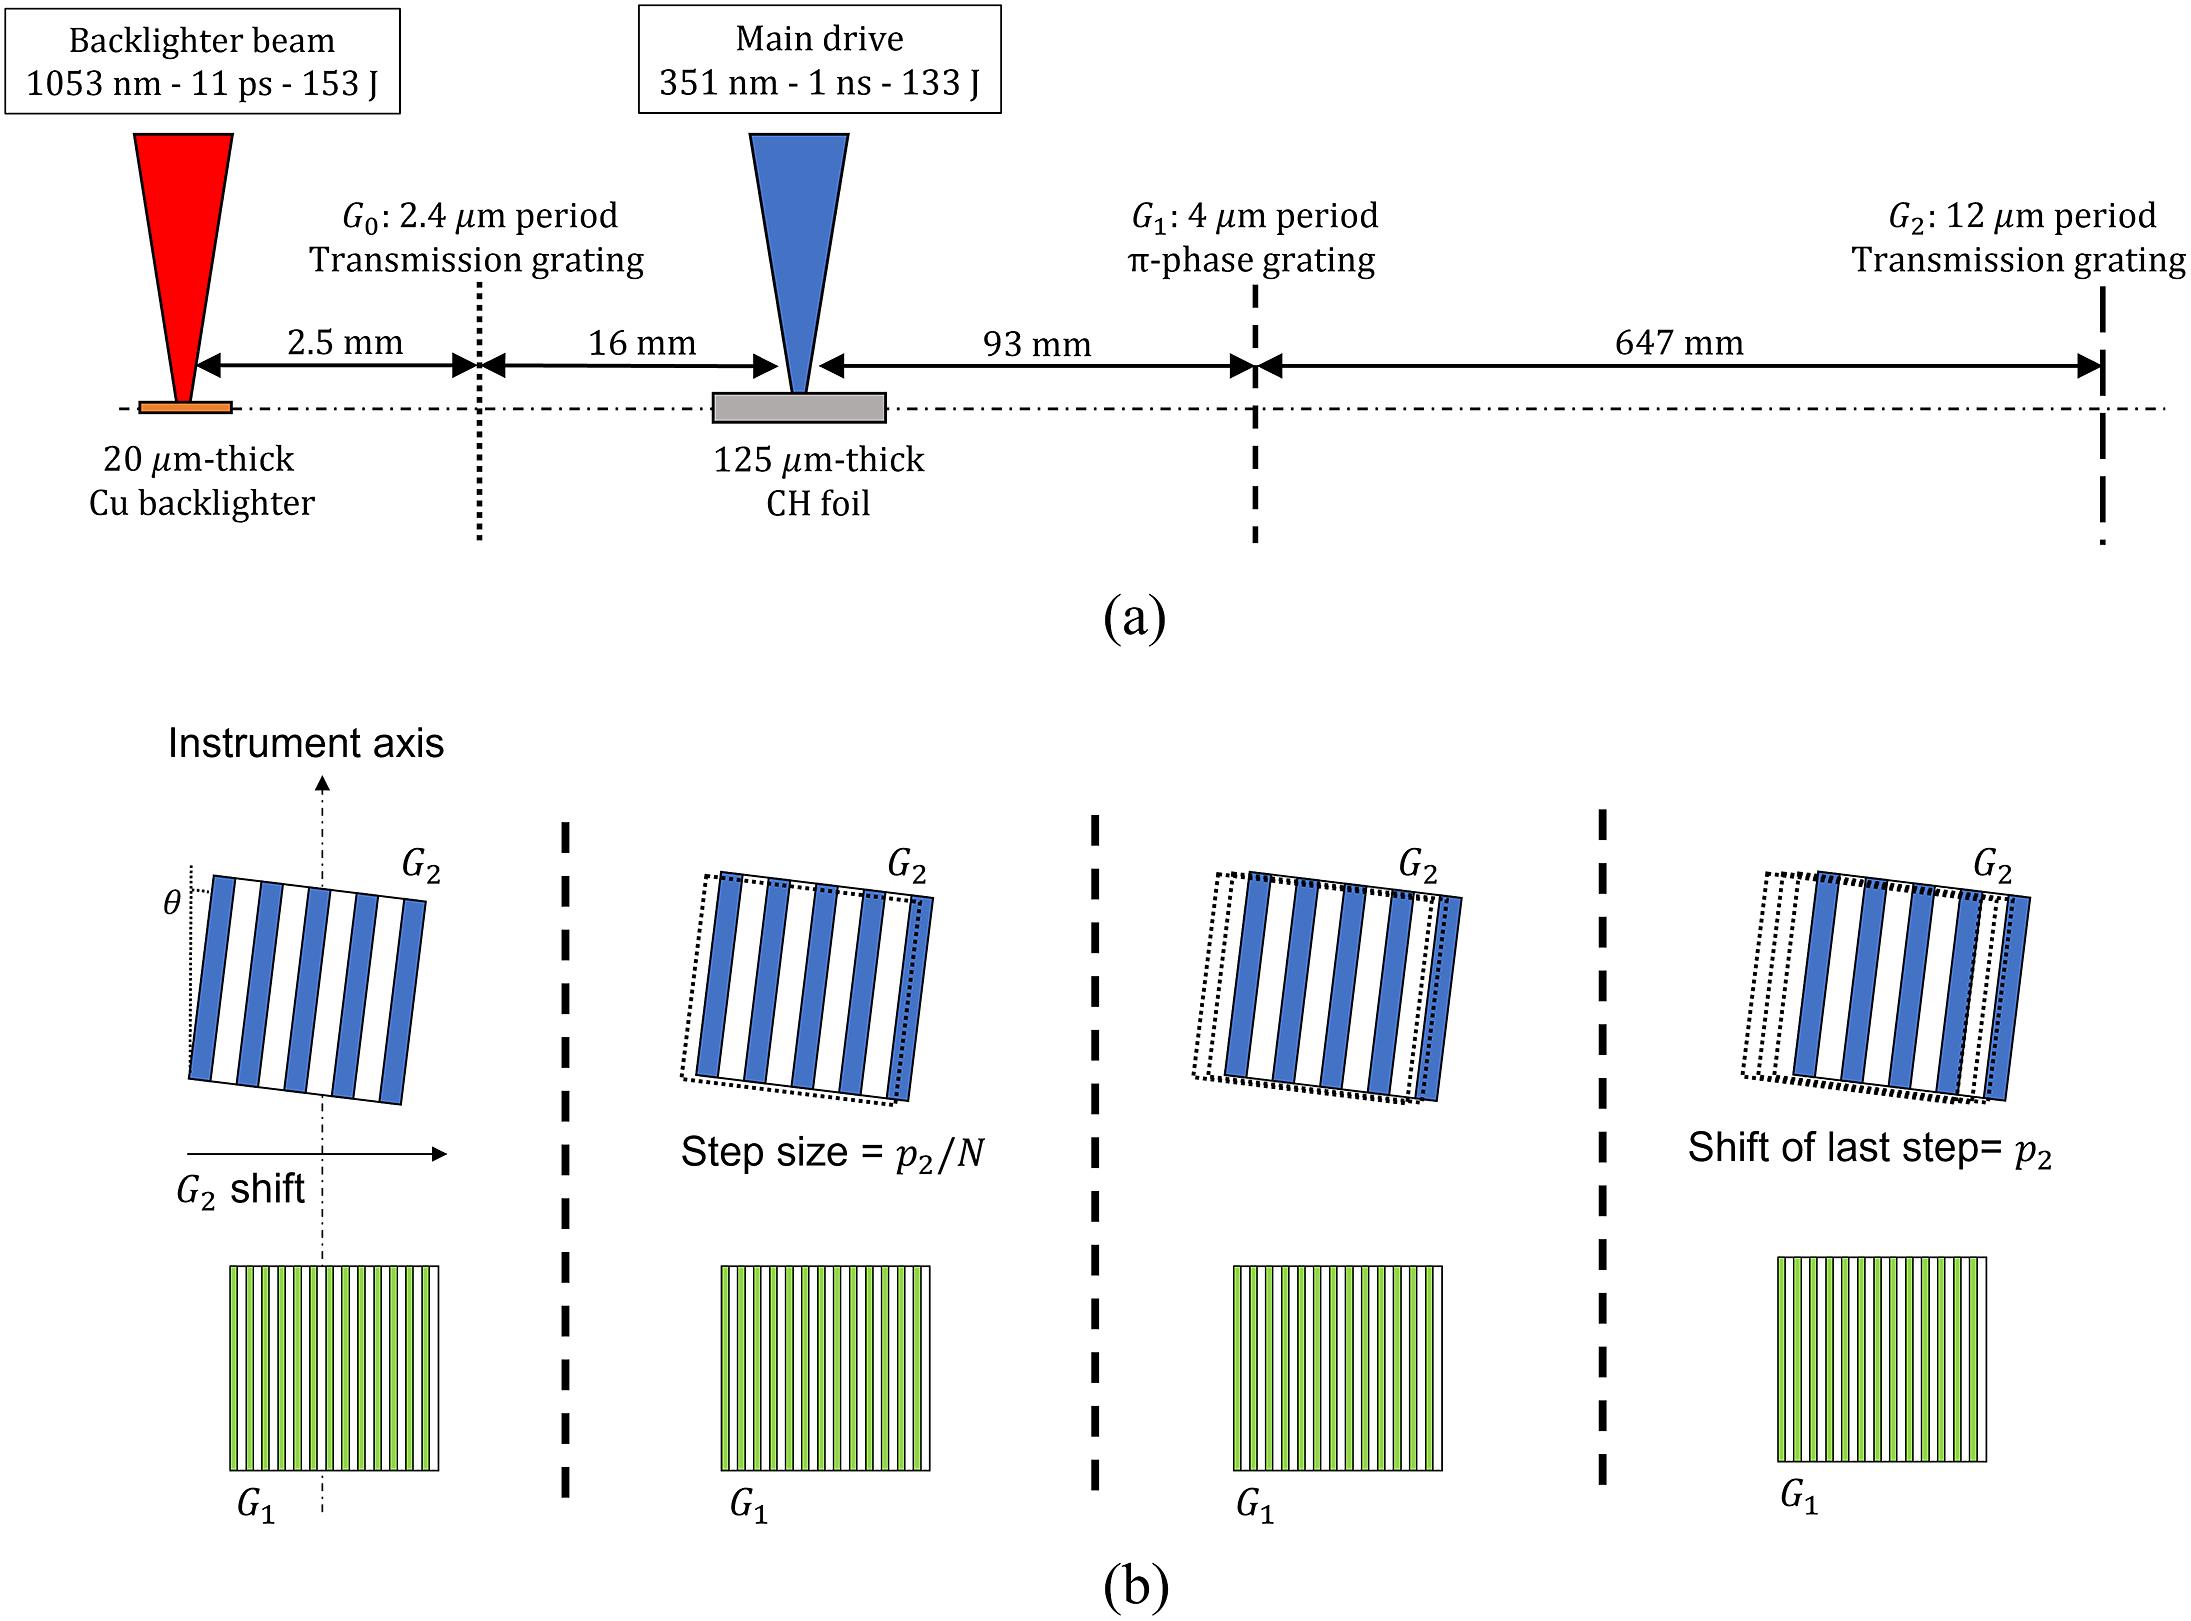
Figure 1.(a) Schematic drawing of the experimental setup. The figure shows the different elements of the interferometer together with the backlighter target, the plasma target and the corresponding laser beams. In this figure,  corresponds to the source grating,
  is the beamsplitter and
  is the analyzer grating described in the text. The dot-dashed line across all elements corresponds to the optical axis of the interferometer. Note that the distances indicated between the different elements are not to scale. (b) Schematic drawing describing how the phase-stepping procedure works. The
  grating is displaced perpendicular to the instrument axis and grating bars, scanning over one full grating period
  (
( ) after
  steps. In this schematic, only four steps in a period are shown and the rotation angle of
  with respect to
  has been exaggerated for clarity (in our experimental setup, this angle was
  ).
).
Talbot–Lau interferometry has been widely used in the field of medical sciences[6–8], since it permits imaging softer tissue than traditional X-ray radiography while keeping a high resolution. In these cases it is common to use the method of phase-stepping, which consists of taking several sequential images for laterally incremental positions of the analyzer grating, spanning one period, as shown schematically in Figure 1(b). The set of images can be used to reconstruct high-resolution phase and transmission images. Consequently, eliminating any non-data-related defects in the images (such as grating imperfections, dead pixels in the detector or similar) is enabled by the method, as only the periodic features are kept. In addition, the position of the analyzer grating that maximizes image contrast can be found by following the intensity curve[9,10], which can be used to obtain refraction-enhanced X-ray images.
In recent years, with the aim of imaging dense plasmas, there have been several efforts to adapt Talbot–Lau interferometry to high-power laser facilities[11] such as PALS[12], the Multi-Terawatt (MTW) facility[13] and OMEGA EP[14], as well as proof-of-concept experiments at lower-energy high-repetition rate lasers[4]. These experiments have permitted a thorough study of the optimal requirements for X-ray backlighting[15], while also providing useful data for analysis tool development. In such experiments, phase-stepping methods are not commonly used, owing to the limited amount of data that can be usually obtained at high-power laser facilities, which impedes taking several images in the same conditions for different positions of the analyzer grating. Furthermore, driver and backlighter laser beams are often close enough to the source grating to cause grating ablation. Therefore, instead of phase-stepping, a deflectometry configuration is used, where the analyzer grating is rotated a small angle
It is in this context that we present the results from a recent experiment at the OMEGA EP laser facility[30,31], where we used Talbot–Lau X-ray interferometry to image the ablation front of a laser-generated plasma, combining Moiré deflectometry and phase-stepping techniques. While Moiré deflectometry was used to image the expanding plasma, reference images (without the plasma) were taken by applying phase-stepping to the same Moiré interferometer configuration. In this case, the reference images can be taken ex situ using a continuous laboratory X-ray source instead of the laser-produced X-ray backlighter source. Note that, as mentioned above, reference image acquisition is a significant limitation in a high-power laser system. Thus, we take advantage of the additional information provided by phase-stepping, while being able to use the Moiré deflectometry technique. We obtained, for the first time, X-ray transmission and phase-shift information of a laser-produced compression wave through a solid. This set of data can provide useful information about the ion and electron density distribution of the plasma.
This paper is structured as follows. In Section 2, a detailed description of the experimental configuration and setup is given, describing both the interferometer and the laser configuration as well as the HED experiment performed. In this section, we also describe how the interferometry reference images were obtained. Section 3 describes the method for analyzing the resulting interferograms, both for the object and the set of reference images. The results from the experiment are shown and discussed in Section 4. Finally, Section 5 presents a summary of the results as well as plans for future improvements to the diagnostic technique.
2 Experimental setup
The experiment was conducted at the OMEGA Extended Performance (EP) facility[30,31], using an identical setup to that described by Valdivia et al.[14]. A
The Talbot–Lau interferometer was designed to work with 8 keV illumination and thus uses the K-shell emission from the copper backlighter target (
A montage of the interferometer is shown in Figure 1(a). It corresponds to the
In Figure 1(a), the backlighter target (Cu foil) is shown on the left, and the plasma (CH foil) target is shown in the middle. The two laser beams are also shown along with the position and periodicities of the
The
![]()
Figure 2.(a) Example of
While most of the backlighter emission corresponds to Cu-K
A series of 15 different reference images were obtained outside of the experimental chamber in order to maximize data collection during the experiments. A medical-grade rotating Cu anode X-ray tube with a focal spot of
The reference images were obtained using the phase-stepping technique[35], where the analyzer grating was shifted perpendicularly to the interferometer line-of-sight over one period (
An example of these reference images is presented in Figure 2(a), clearly showing the interference Moiré fringes. The red line in the image indicates the normalized intensity profile (averaged), which shows that a
Figure 2(b) presents the interferometer phase curve, which is obtained from the phase-stepping procedure. Here, the normalized average intensity within a central
3 Analysis of the interferograms
The Moiré images obtained both for the object and reference have two main components, namely the underlying image and the periodic contribution that arises from the interferometry itself. In the case of the reference image, since phase-stepping was used, there is an additional periodic component (corresponding to the shifting of the analyzer grating) that must be taken into account. For this reason, the obtained interferograms can be written as follows:
and
where
In the equations above, the contribution
The functions
On the other hand,
Separating the
3.1 Object image: no phase-stepping
To extract the different components of the object interferogram, the easiest way is to work in Fourier space and express the obtained image as a function of its frequency components. In this case,
where
where
and
where the symbol
and
3.2 Reference image: phase-stepping
For the case of the reference images, the process is similar. However, we take advantage of the additional periodicity introduced by the phase-stepping (see Figure 2(b)). For every point
where
and
By taking the real and imaginary parts of the natural logarithm of
Once the functions
4 Results
Figure 3 shows the Moiré interferogram obtained in the experiment. The signal-to-noise ratio (SNR) in the data was approximately 1.7, which lowered the Moiré fringe contrast further beyond the limitations imposed by the non-monochromaticity of the backlighter emission (as mentioned in Section 2). The central dark region corresponds to the target that is being ablated, whereas the interferometry fringes can be seen on both sides of it. The target was irradiated from the left-hand side. Similar to Figure 2(a), the fringe profile is shown in red. A contrast of
![]()
Figure 3.Interferometry image of the ablated plasma. The dark vertical feature around  corresponds to the CH foil. Note that the direction of the phase-change detection coincides with the Moiré fringes, which are oriented horizontally in our experiment. The region indicated with the red-dashed square corresponds to the field of view of the reference images and, therefore, to the region that was analyzed. The region within the white-dotted square corresponds to the region of consideration, after removing the edges to avoid the Gibbs phenomenon and possible grating imperfections. Similar to
  ). Note that the contrast plot has been scaled to improve the view.
Since the detector used for Talbot–Lau rail X-ray alignment and calibration has a smaller chip size than that used in the experiment, the field of view of the reference images was smaller than that of the object image. To obtain a direct comparison, the field of view of the images recorded in the experiment was reduced to the region shown in the figure with a red-dashed square.
The postprocessing module of the Talbot Interferometry Analysis (TIA) code[5], named the Talbot Numerical Tool (TNT)[11], was used to separate the different Fourier components of both the data and reference images, following the procedure described in the previous section. This tool has been developed to automatically detect the peaks corresponding to the periodicity of the fringes in the Fourier spectra of noisy images, which was fundamental to detect and analyze the low-contrast fringes in the data presented.
In order to benchmark the obtained results, we ran 2D simulations of the plasma ablation with the magneto-hydrodynamics (MHD) code FLASH[37–39], using the experimental parameters. The simulations were run using adaptative mesh refinement (AMR) with a maximum spatial resolution of
A summary of the results is presented in Figure 4, where Figures 4(b) and 4(c) correspond to the attenuation and phase-shift curves, respectively, integrated over the region of interest. The shaded regions in each plot mark the original position and size of the CH target, after accounting for the spatial resolution of the instrument. In order to avoid edge effects or the Gibbs phenomenon from the Fourier analysis, the data in Figure 4 correspond to 75% of the effective field of view (white square in Figure 3). Figure 4(a) shows a close-up of the interferometry image in the region of interest for reference. In addition, guiding lines (vertical red-dashed lines) have been added in order to indicate the region of the target that has been shocked by the laser drive.
In Figure 4(b), it can be seen that while the transmission of radiation through the target is constant in the unshocked material, this is not the case for the shocked region. In said region (between the red guiding lines), the transmission is lower as the material density is increased. Around
![]()
Figure 4.(a) Cropped region from the interferometry data corresponding to the field of view of the reference images (red square in  and
and  coordinates correspond to the white-dotted square in
At the time of consideration (0.5 ns after the start of the laser pulse), the shocked region of the target has not yet heated up and ionized. Therefore, it is possible to use the tabulated values of the mass absorption coefficient for cold polystyrene to obtain an estimate of the mass density of the target from the transmission data. By assuming uniform density across the laser spot (
In Figure 4(c), we have included the phase shift obtained by using the phase-stepping analysis described above, indicated with a green solid line, together with the equivalent result obtained without phase-stepping (i.e., using a single, best-correlated reference image), marked with a brown dotted line. Notably, this highlights the benefits of the phase-stepping technique, without which no phase structure can be seen in the data. The rise in the absolute value of the phase shift observed at both edges of the target is caused by the gradient in electron density from the CH target to the vacuum. The error region corresponds to a
In order to compare the obtained phase shifts with the simulations, we note that the phase shift is directly related to the electron density of the plasma, as follows[46]:
where
The phase shift obtained from the simulations is shown in Figure 4(c) as the black dashed line. Good agreement is found between the simulations and the measured values, especially for the front of the target (
The second y-axis in Figure 4(c) indicates the refraction angle of the X-rays for different regions of the target. This angle
where
Note that, while the critical density for 8 keV photon energy is
5 Conclusions and future work
We have presented the first X-ray interferometry image of an ablating HED plasma obtained at a high-power laser facility, probed by a Talbot–Lau X-ray interferometer. From this image, both phase-contrast radiography (attenuation) and phase-shift data of the ablating plasma have been retrieved.
By using ex situ phase-stepping, we were able to obtain phase-stepped reference images for our analysis, without loss of beamtime. This allowed us to obtain high-quality phase-shift data despite marginal photon statistics, reflected by the low SNR of the interferometry signal (
The obtained data show different features from the ablated plasma and the target edge. In particular, an absolute measurement of the phase shift from the ablated plasma has been obtained, finding good agreement with the predictions from hydrodynamic simulations, which indicates that the electron density is above the range that can be probed with optical means. This proves that the Talbot–Lau interferometry technique can be used in HED experiments to characterize and map the hydrodynamic evolution and behavior of laser-driven plasmas well above
The data obtained with this technique can provide meaningful insights into the physics of the ablation zone in laser-generated plasmas (a requirement to benchmark current theoretical models), as it allows direct probing into the dense ablated regions. In addition, this experimental platform and diagnostic can be used to study the process of species separation in plasmas with more than one element (such as CH), which is necessary to discriminate among diffusion models.
Future work includes further developments to the OMEGA EP Talbot–Lau X-ray Deflectometer (EP-TXD) diagnostic to enhance signal quality and fringe contrast by improving spatial resolution and X-ray backlighter spectra. Backlighter target geometry and orientation with respect to the incident laser will be explored to improve system spatial resolution and overall signal quality in combination with optimization of the laser parameters. The addition of a laterally graded multilayer mirror to the OMEGA EP-TXD will ensure monochromaticity of the X-ray backlighter radiation[11] by removing contributions from higher energy lines (such as the He
References
[1] D. Stutman, M. Finkenthal. Rev. Sci. Instrum., 82, 113508(2011).
[2] H. F. Talbot. London, Edinburgh, Dublin Philos. Mag. J. Sci., 9, 401(1836).
[3] E. Lau. Ann. Phys., 437, 417(1948).
[4] V. Bouffetier, L. Ceurvorst, M. Valdivia, F. Dorchies, S. Hulin, T. Goudal, D. Stutman, A. Casner. Appl. Opt., 59, 8380(2020).
[5] G. Pérez-Callejo, V. Bouffetier, L. Ceurvorst, T. Goudal, M. Valdivia, D. Stutman, A. Casner. Phys. Plasmas, 29, 043901(2022).
[6] A. Momose, W. Yashiro, H. Maikusa, Y. Takeda. Opt. Express, 17, 12540(2009).
[7] F. Pfeiffer, O. Bunk, C. David, M. Bech, G. Le Duc, A. Bravin, P. Cloetens. Phys. Med. Biol., 52, 6923(2007).
[8] T. Weitkamp, C. David, O. Bunk, J. Bruder, P. Cloetens, F. Pfeiffer. Eur. J. Radiol., 68, S13(2008).
[9] Y. Surrel. Appl. Opt., 32, 3598(1993).
[10] Y. Surrel. Appl. Opt., 35, 51(1996).
[11] M. P. Valdivia, G. Perez-Callejo, V. Bouffetier, G. W. Collins, C. Stoeckl, T. Filkins, C. Mileham, M. Romanofsky, I. A. Begishev, W. Theobald, S. R. Klein, M. K. Schneider, F. N. Beg, A. Casner, D. Stutman. Rev. Sci. Instrum., 93, 115102(2022).
[12] J. Nejdl, M. Kozlová, T. Mocek, B. Rus. Phys. Plasmas, 17, 122705(2010).
[13] M. Valdivia, D. Stutman, C. Stoeckl, W. Theobald, C. Mileham, I. Begishev, J. Bromage, S. Regan. Rev. Sci. Instrum., 87, 023505(2016).
[14] M. Valdivia, D. Stutman, C. Stoeckl, C. Mileham, J. Zou, S. Muller, K. Kaiser, C. Sorce, P. Keiter, J. Fein, M. Trantham, R. P. Drake, S. P. Regan. Rev. Sci. Instrum., 91, 023511(2020).
[15] M. P. Valdivia, F. Veloso, D. Stutman, C. Stoeckl, C. Mileham, I. A. Begishev, W. Theobald, M. Vescovi, W. Useche, S. P. Regan, B. Albertazzi, G. Rigon, P. Mabey, T. Michel, S. A. Pikuz, M. Koenig, A. Casner. Rev. Sci. Instrum., 89, 10G127(2018).
[16] J. Krasinski, D. F. Heller, O. Kafri. Appl. Opt., 24, 3032(1985).
[17] A. Momose, S. Kawamoto, I. Koyama, Y. Hamaishi, K. Takai, Y. Suzuki. Jpn. J. Appl. Phys., 42, L866(2003).
[18] B. Moosman, V. Bystritskii, C. Boswell, F. Wessel. Rev. Sci. Instrum., 67, 170(1996).
[19] J. Ruiz-Camacho, F. Beg, P. Lee. J. Phys. D: Appl. Phys., 40, 2026(2007).
[20] J. Valenzuela, E. Wyndham, H. Chuaqui, D. Cortes, M. Favre, H. Bhuyan. J. Appl. Phys., 111, 103301(2012).
[21] M. Valdivia, D. Stutman, M. Finkenthal. J. Appl. Phys., 114, 163302(2013).
[22] M. Valdivia, D. Stutman, M. Finkenthal. Rev. Sci. Instrum., 85, 073702(2014).
[23] M. Valdivia, D. Stutman, M. Finkenthal. Appl. Opt., 54, 2577(2015).
[24] D. Stutman, M. P. Valdivia, M. Finkenthal. Appl. Opt., 54, 5956(2015).
[25] J. Valenzuela, E. Wyndham, M. Favre. Phys. Plasmas, 22, 083501(2015).
[26] S. Bachche, M. Nonoguchi, K. Kato, M. Kageyama, T. Koike, M. Kuribayashi, A. Momose. Sci. Rep., 7, 6711(2017).
[27] M. Seifert, M. Gallersdörfer, V. Ludwig, M. Schuster, F. Horn, G. Pelzer, J. Rieger, T. Michel, G. Anton. J. Imaging, 4, 62(2018).
[28] S. Balovsiak, S. Novikov, I. Fodchuk, I. Yaremchuk. Metallophys. Adv. Technol., 41, 389(2019).
[29] H. Lee, D. Jeon, H. Lim, H. Cho, M. Park, W. Youn. J. Opt., 23, 105605(2021).
[30] L. Waxer, D. Maywar, J. Kelly, T. Kessler, B. Kruschwitz, S. Loucks, R. McCrory, D. Meyerhofer, S. Morse, C. Stoeckl, J. Zuegel. Opt. Photonics News, 16, 30(2005).
[31] J. Kelly, L. Waxer, V. Bagnoud, I. Begishev, J. Bromage, B. Kruschwitz, T. Kessler, S. Loucks, D. Maywar, R. McCrory, D. Meyerhofer, S. Morse, J. Oliver, A. Rigatti, A. Schmid, C. Stoeckl, S. Dalton, L. Folnsbee, M. Guardalben, R. Jungquist, J. Puth, M. Shoup, D. Weiner, J. Zuegel. J. Phys. IV, 133, 75(2006).
[32] O. Kafri. Opt. Lett., 5, 555(1980).
[33] O. Kafri, A. Livnat. Appl. Opt., 20, 3098(1981).
[34] J. Stricker, O. Kafri. AIAA J., 20, 820(1982).
[35] M. P. Valdivia, D. Stutman, C. Stoeckl, C. Mileham, I. A. Begishev, J. Bromage, S. P. Regan. Appl. Opt., 57, 138(2018).
[36] F. Pfeiffer, M. Bech, O. Bunk, P. Kraft, E. F. Eikenberry, C. Brönnimann, C. Grünzweig, C. David. Nat. Mater., 7, 134(2008).
[37] B. Fryxell, K. Olson, P. Ricker, F. Timmes, M. Zingale, D. Lamb, P. MacNeice, R. Rosner, J. Truran, H. Tufo. Astrophys. J. Suppl. Ser., 131, 273(2000).
[38] A. Dubey, K. Antypas, M. K. Ganapathy, L. B. Reid, K. Riley, D. Sheeler, A. Siegel, K. Weide. Parallel Comput., 35, 512(2009).
[39] P. Tzeferacos, M. Fatenejad, N. Flocke, C. Graziani, G. Gregori, D. Lamb, D. Lee, J. Meinecke, A. Scopatz, K. Weide. High Energy Density Phys., 17, 24(2015).
[40] J. MacFarlane, I. Golovkin, P. Woodruff, J. Quant. Spectrosc. Radiat. Transfer, 99, 381(2006).
[41] Y. Ping, O. Landen, D. Hicks, J. Koch, R. Wallace, C. Sorce, B. Hammel, G. Collins. J. Instrum., 6, P09004(2011).
[42] J. A. Koch, O. L. Landen, L. J. Suter, L. P. Masse. J. Opt. Soc. Am. A, 30, 1460(2013).
[43] B. Kozioziemski, J. Koch, A. Barty, H. Martz, W.-K. Lee, K. Fezzaa. J. Appl. Phys., 97, 063103(2005).
[44] J. A. Koch, O. L. Landen, B. J. Kozioziemski, N. Izumi, E. L. Dewald, J. D. Salmonson, B. A. Hammel. J. Appl. Phys., 105, 113112(2009).
[45] J. A. Koch, O. L. Landen, L. J. Suter, L. P. Masse, D. S. Clark, J. S. Ross, A. J. Mackinnon, N. B. Meezan, C. A. Thomas, Y. Ping. Appl. Opt., 52, 3538(2013).
[46] A. Momose, W. Yashiro, Y. Takeda, Y. Suzuki, T. Hattori. Jpn. J. Appl. Phys., 45, 5254(2006).
[47] M. Born, E. Wolf. Principles of Optics: Electromagnetic Theory of Propagation, Interference and Diffraction of Light(2013).
[48] A. Momose. Jpn. J. Appl. Phys., 44, 6355(2005).


Set citation alerts for the article
Please enter your email address

© Copyright 2018-2021 | Chinese Laser Press. All Rights Reserved 沪ICP备15018463号-20