
Chao ZHANG, Lin ZHU, Jin-jia GUO, Nan LI, Ye TIAN, Rong-er ZHENG. Laser-Induced Breakdown Spectroscopy for Heavy Metal Analysis of Zn of Ocean Sediments[J]. Spectroscopy and Spectral Analysis, 2020, 40(11): 3617
- Spectroscopy and Spectral Analysis
- Vol. 40, Issue 11, 3617 (2020)
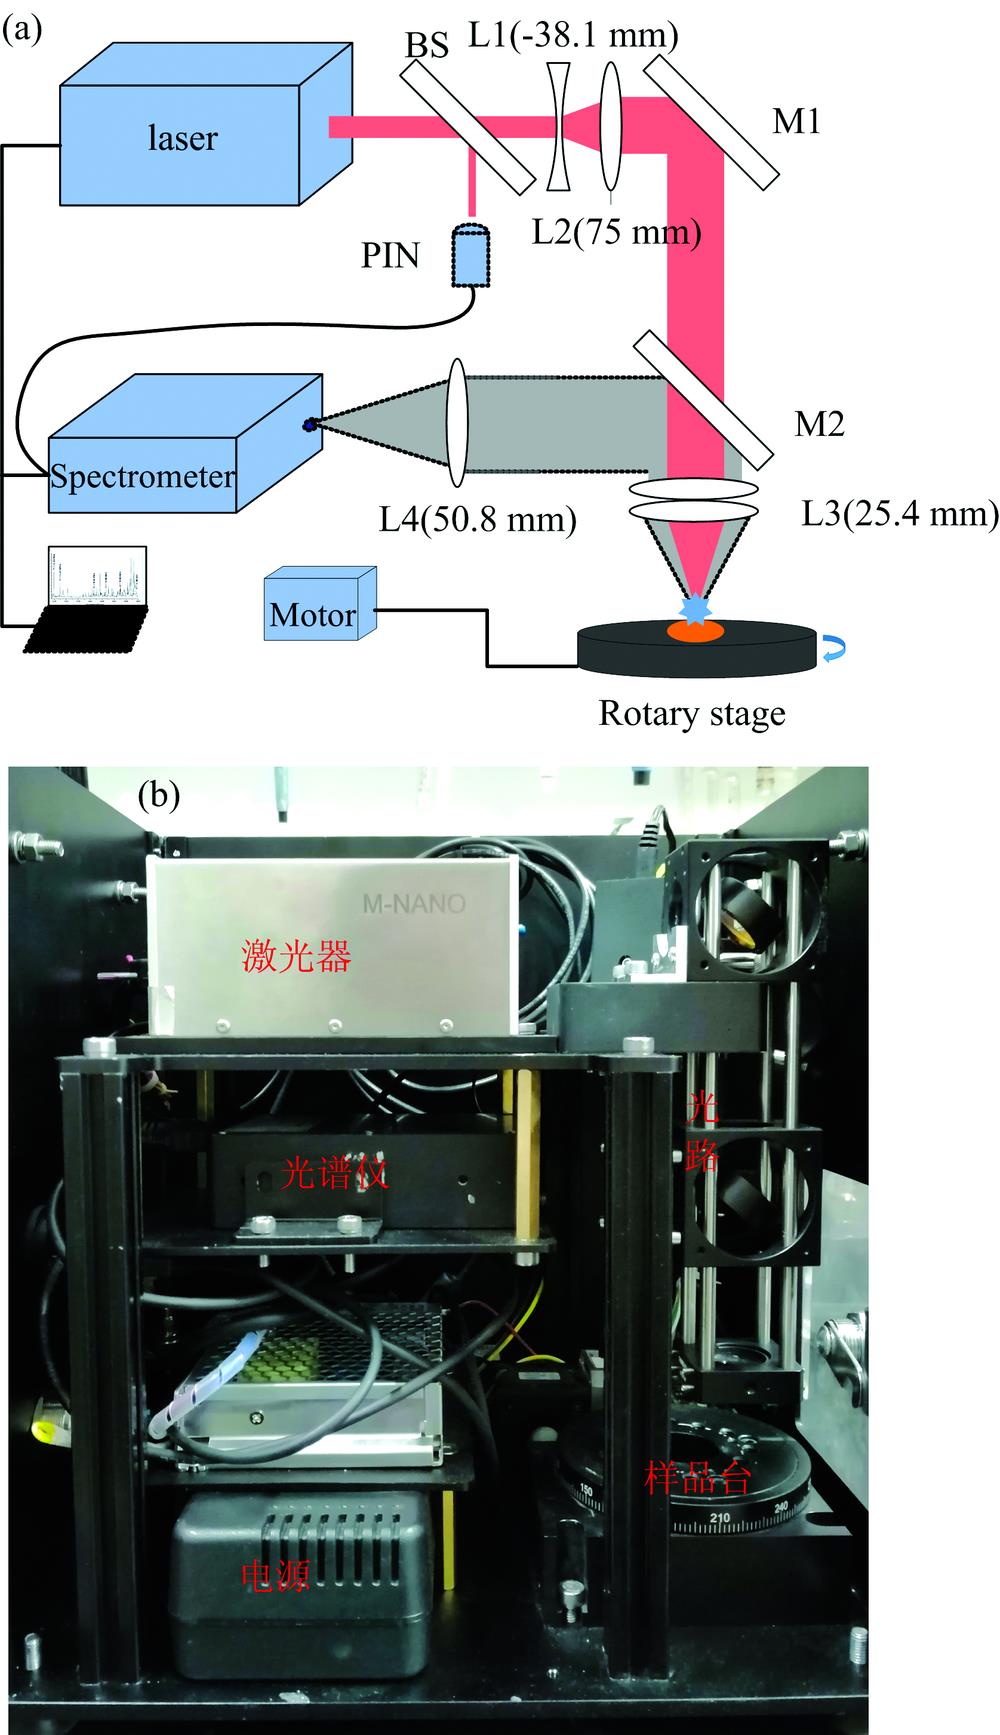
Fig. 1. Schematic diagram of the portable LIBS instrument
(a): Optical layout;(b): Internal structure charts of the instrument
(a): Optical layout;(b): Internal structure charts of the instrument
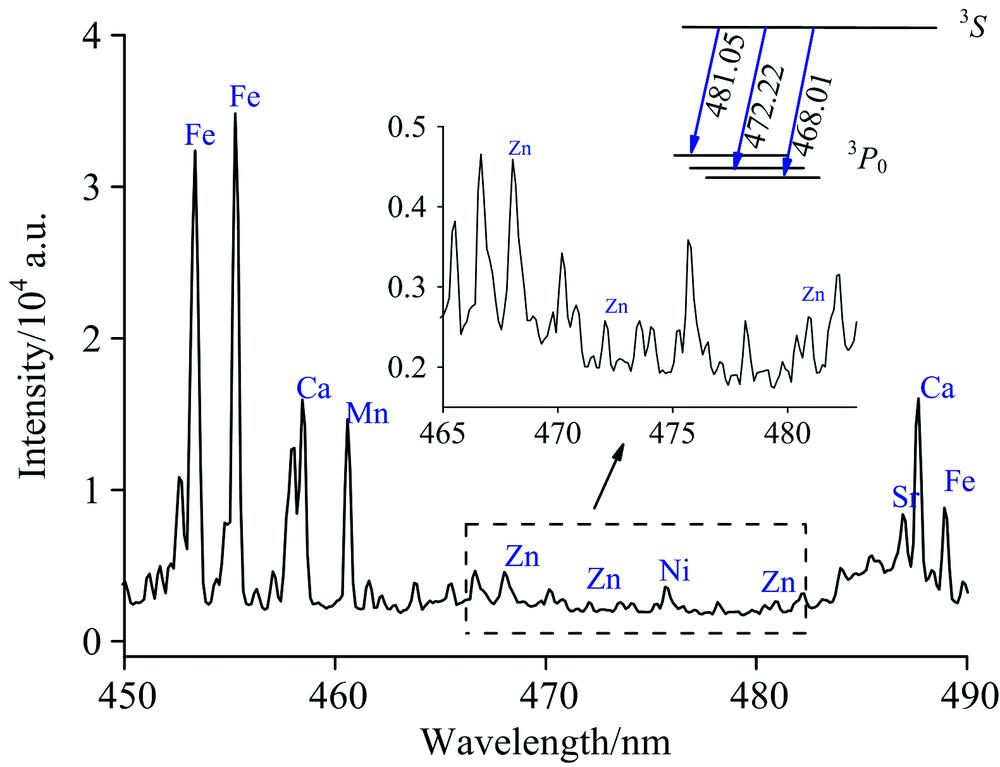
Fig. 2. A typical sediment LIBS spectrum
Fig. 3. Flow chart of concentration prediction of Zn in sediment using portable LIBS system
Fig. 4. The RSD results of Zn with different standardized methods
Fig. 5. Calibration curve for Zn in sediment
(a): Calibration curve for Zn with univariate quantitative method; (b): Calibration curve for Zn with BP neural network
(a): Calibration curve for Zn with univariate quantitative method; (b): Calibration curve for Zn with BP neural network
Fig. 6. The emission intensities of Ca Ⅰ 422 nm and Zn Ⅰ 468 nm as a function of sample’s drying time
Fig. 7. Field measurements pictures and site positions in Jiaozhou Bay
(a): Field measurement picture of the portable LIBS system; (b): Site map for sediments sampling;(c): Picture of a typical sediment sample; (d): A typical sediment LIBS spectrum on site
(a): Field measurement picture of the portable LIBS system; (b): Site map for sediments sampling;(c): Picture of a typical sediment sample; (d): A typical sediment LIBS spectrum on site
|
Table 1. AAS detection results of the concentration of Zn in experimental samples
|
Table 2. Quantitative result of three analysis methods
|
Table 3. Comparisons of LIBS measurements on site and AAS results in lab

Set citation alerts for the article
Please enter your email address
© Copyright 2018-2021 | Chinese Laser Press. All Rights Reserved 沪ICP备15018463号-20