• Photonics Research
  • Vol. 9, Issue 4, 501 (2021)
Shiyin Cao1, Liping Hou1, Qifa Wang1, Chenyang Li1, Weixing Yu2, Xuetao Gan1、5、*, Kaihui Liu3, Malin Premaratne4, Fajun Xiao1、2、6、*, and Jianlin Zhao1、7、*
Author Affiliations
  • 1MOE Key Laboratory of Material Physics and Chemistry under Extraordinary Conditions, and Shaanxi Key Laboratory of Optical Information Technology, School of Physical Science and Technology, Northwestern Polytechnical University, Xi’an 710129, China
  • 2Key Laboratory of Spectral Imaging Technology of Chinese Academy of Sciences, Xi’an 710119, China
  • 3State Key Laboratory for Mesoscopic Physics, Collaborative Innovation Centre of Quantum Matter, School of Physics, Peking University, Beijing 100871, China
  • 4Advanced Computing and Simulation Laboratory (AχL), Department of Electrical and Computer Systems Engineering, Monash University, Clayton, VIC 3800, Australia
  • 5e-mail: xuetaogan@nwpu.edu.cn
  • 6e-mail: fjxiao@nwpu.edu.cn
  • 7e-mail: jlzhao@nwpu.edu.cn
  • show less
    DOI: 10.1364/PRJ.414613 Cite this Article Set citation alerts
    Shiyin Cao, Liping Hou, Qifa Wang, Chenyang Li, Weixing Yu, Xuetao Gan, Kaihui Liu, Malin Premaratne, Fajun Xiao, Jianlin Zhao. Augmenting photoluminescence of monolayer MoS2 using high order modes in a metal dimer-on-film nanocavity[J]. Photonics Research, 2021, 9(4): 501 Copy Citation Text show less
    (a) Schematic of Au nanosphere dimer-on-film nanocavity (DoFN) composed of the Au nanosphere dimer and Au film spaced by the monolayer MoS2 and Al2O3. (b) Bright- and (c) dark-field images of the Au dimer DoFNs. The white boxes denote the Au dimer measured in the optical setups. (d) SEM image of the DoFN. (e) Raman spectrum of the monolayer MoS2 taken nearby the dimer.
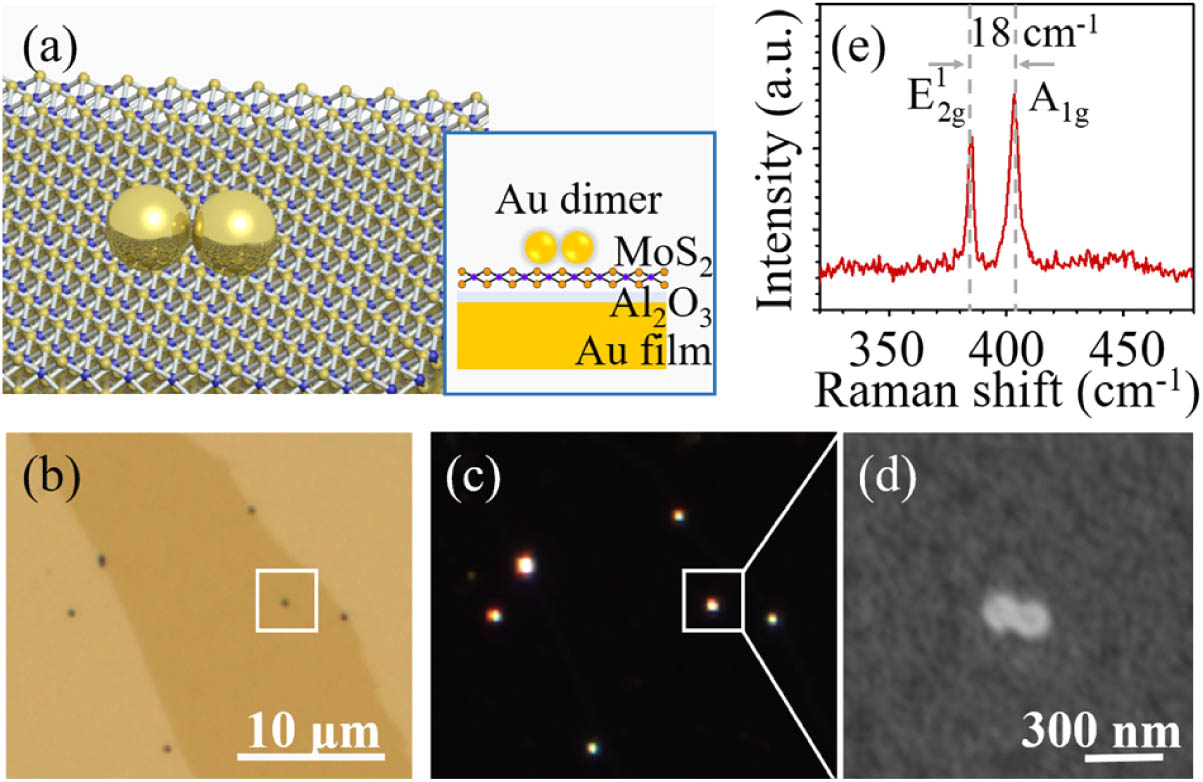
    Fig. 1. (a) Schematic of Au nanosphere dimer-on-film nanocavity (DoFN) composed of the Au nanosphere dimer and Au film spaced by the monolayer MoS2 and Al2O3. (b) Bright- and (c) dark-field images of the Au dimer DoFNs. The white boxes denote the Au dimer measured in the optical setups. (d) SEM image of the DoFN. (e) Raman spectrum of the monolayer MoS2 taken nearby the dimer.
    (a)–(d) Scattering spectra of Au nanosphere DoFNs illuminated with two typical wave vectors and polarizations shown in the insets of left panels. Here, the left and right panels are for the experiment and simulation results, respectively.
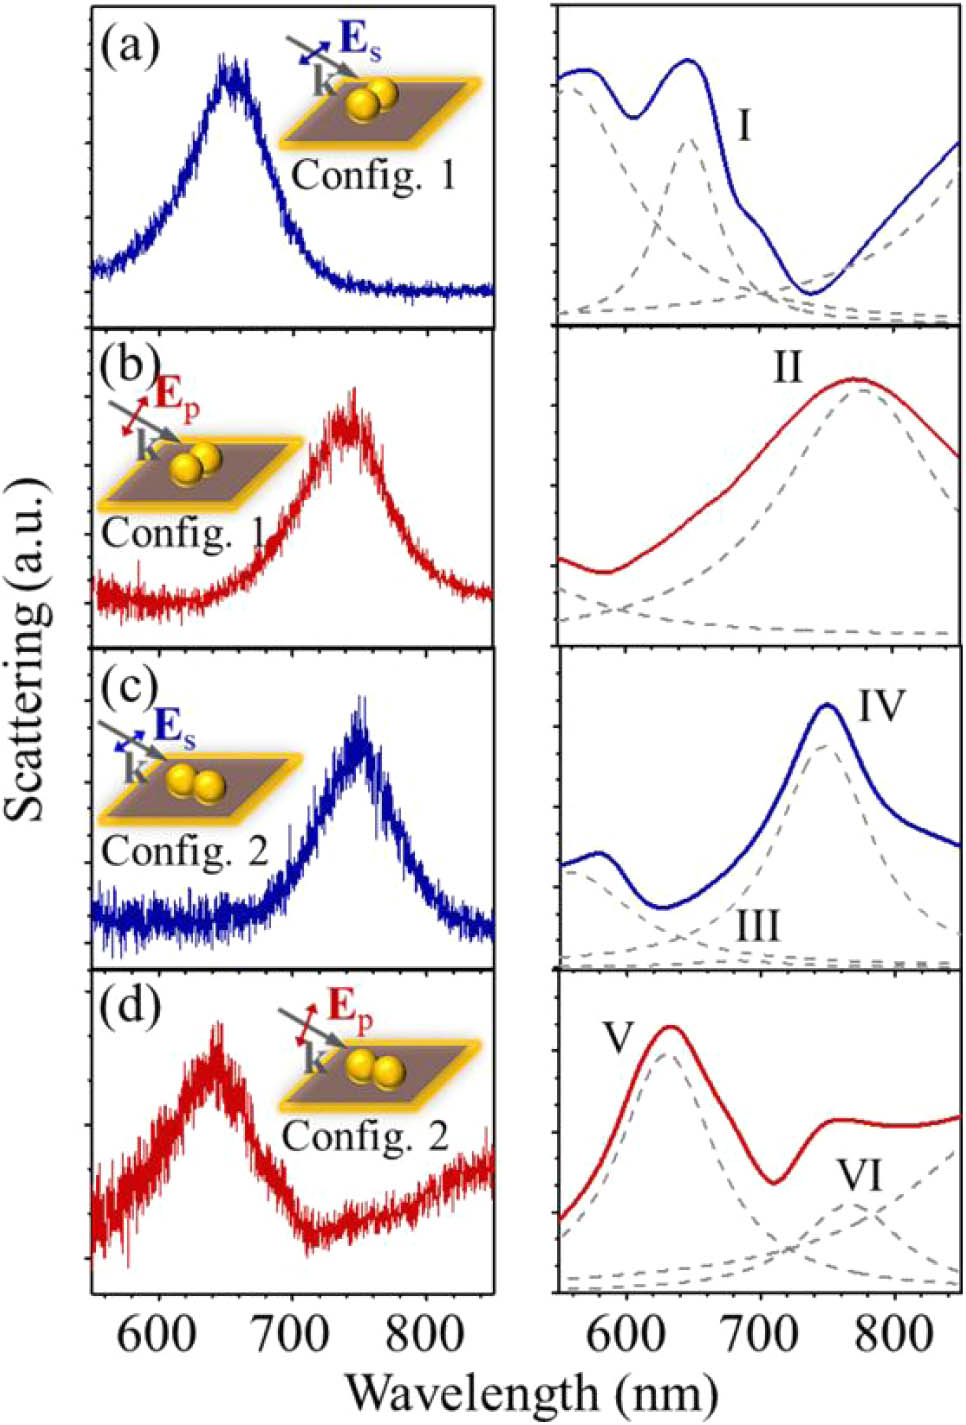
    Fig. 2. (a)–(d) Scattering spectra of Au nanosphere DoFNs illuminated with two typical wave vectors and polarizations shown in the insets of left panels. Here, the left and right panels are for the experiment and simulation results, respectively.
    (a)–(f) Charge distributions (upper panels) and electric field enhancement maps (lower panels) of modes I–VI shown in Fig. 2.
    Fig. 3. (a)–(f) Charge distributions (upper panels) and electric field enhancement maps (lower panels) of modes I–VI shown in Fig. 2.
    (a) Photoluminescence (PL) spectra of MoS2 around the DoFNs (red and blue curves for polarization along and perpendicular to dimer axis, respectively) and on bare Au film (black curve with 8× magnification). (b) Polarization dependence of the PL peak intensity. Insets in (a) and (b) are the quantum yield enhancement at 685 nm and PL excitation configuration, respectively.
    Fig. 4. (a) Photoluminescence (PL) spectra of MoS2 around the DoFNs (red and blue curves for polarization along and perpendicular to dimer axis, respectively) and on bare Au film (black curve with 8× magnification). (b) Polarization dependence of the PL peak intensity. Insets in (a) and (b) are the quantum yield enhancement at 685 nm and PL excitation configuration, respectively.
    Shiyin Cao, Liping Hou, Qifa Wang, Chenyang Li, Weixing Yu, Xuetao Gan, Kaihui Liu, Malin Premaratne, Fajun Xiao, Jianlin Zhao. Augmenting photoluminescence of monolayer MoS2 using high order modes in a metal dimer-on-film nanocavity[J]. Photonics Research, 2021, 9(4): 501
    Download Citation