• Spectroscopy and Spectral Analysis
  • Vol. 42, Issue 3, 889 (2022)
Chao-shuai HU*, Yun-liang XU1;, Hong-yu CHU1;, Jun-xia CHENG1;, Li-juan GAO1;, Ya-ming ZHU1; 2; *;, and Xue-fei ZHAO1; 2; *;
Author Affiliations
  • 1. College of Chemical Engineering, University of Science and Technology Liaoning, Anshan 114051, China
  • show less
    DOI: 10.3964/j.issn.1000-0593(2022)03-0889-07 Cite this Article
    Chao-shuai HU, Yun-liang XU, Hong-yu CHU, Jun-xia CHENG, Li-juan GAO, Ya-ming ZHU, Xue-fei ZHAO. FTIR Analysis of the Correlation Between the Pyrolysis Characteristics and Molecular Structure of Ultrasonic Extraction Derived From Mid-Temperature Pitch[J]. Spectroscopy and Spectral Analysis, 2022, 42(3): 889 Copy Citation Text show less
    FTIR spectra of 8 samples
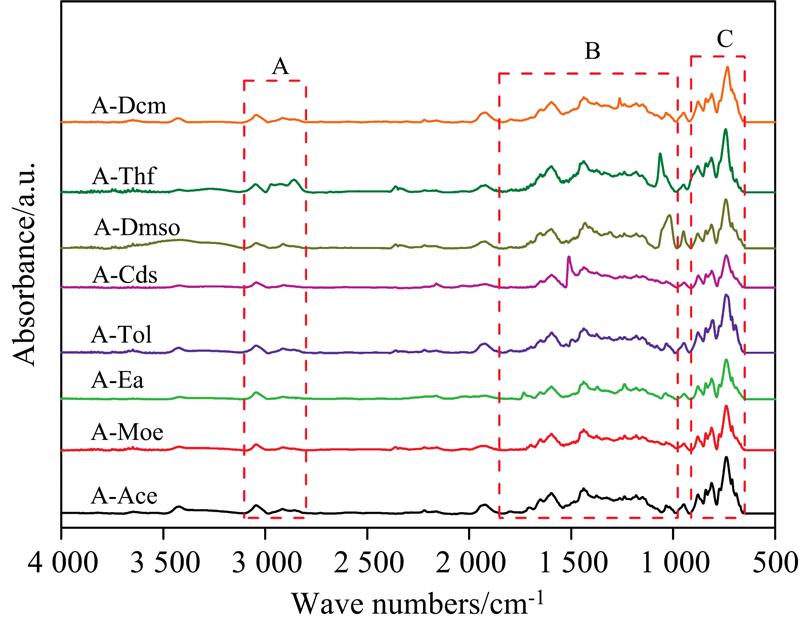
    Fig. 1. FTIR spectra of 8 samples
    Curve-fitted spectra of peak separation in the four regions of FTIR spectrum (taking A-Ace for example)(a): 700~900 cm-1; (b): 1 000~1 800 cm-1; (c): 2 800~3 000 cm-1; (d): 3 000~3 100 cm-1
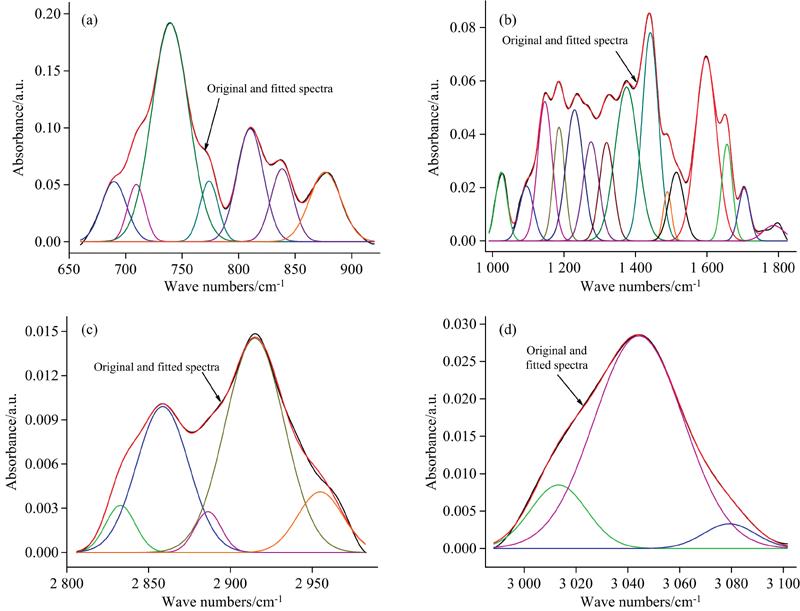
    Fig. 2. Curve-fitted spectra of peak separation in the four regions of FTIR spectrum (taking A-Ace for example)
    (a): 700~900 cm-1; (b): 1 000~1 800 cm-1; (c): 2 800~3 000 cm-1; (d): 3 000~3 100 cm-1
    (a) TG curves of 8 samples at 10 K·min-1 heating rate; (b) TG curves of A-Ace sample at different heating rates
    Fig. 3. (a) TG curves of 8 samples at 10 K·min-1 heating rate; (b) TG curves of A-Ace sample at different heating rates
    (a) FWO and (b) KAS methods for Ea (taking A-Ace for example)
    Fig. 4. (a) FWO and (b) KAS methods for Ea (taking A-Ace for example)
    The fitting relationship diagram of pyrolysis activation energy and single index(a): I1; (b): I2; (c): I3; (d): I4; (e): I5; (f): I6
    Fig. 5. The fitting relationship diagram of pyrolysis activation energy and single index
    (a): I1; (b): I2; (c): I3; (d): I4; (e): I5; (f): I6
    SamplesExtraction rate/%
    A-Ace32.32
    A-Moe35.77
    A-Ea36.96
    A-Dmso45.87
    A-Tol50.33
    A-Dcm62.51
    A-Cds69.43
    A-Thf79.79
    Table 1. Extraction rate of all solvents
    SamplesI1I2I3I4I5I6
    A-Ace0.202 80.133 50.728 73.493 42.794 412.023 0
    A-Moe0.158 10.133 30.690 03.508 66.011 615.365 5
    A-Ea0.168 80.130 80.808 74.479 14.033 111.060 0
    A-Dmso0.139 20.125 50.642 82.812 34.214 615.162 9
    A-Tol0.205 60.192 30.677 53.995 42.749 016.525 1
    A-Dcm0.196 40.204 60.691 93.629 63.209 114.640 8
    A-Cds0.181 90.022 60.884 43.709 916.703 212.322 9
    A-Thf0.380 40.149 90.540 62.992 71.162 918.482 8
    Table 2. Structural parameters derived from FTIR of all extracts
    SamplesEa/(J·mol-1)
    FWOKASAverage
    A-Ace95 65291 41693 534
    A-Moe94 38690 14592 266
    A-Ea100 93596 95698 946
    A-Dmso102 00198 160100 081
    A-Tol84 47379 42181 947
    A-Dcm101 39997 18199 290
    A-Cds118 264114 807116 536
    A-Thf80 72275 46778 095
    Table 3. The Ea of all extracts calculated by FWO and KAS methods
    Chao-shuai HU, Yun-liang XU, Hong-yu CHU, Jun-xia CHENG, Li-juan GAO, Ya-ming ZHU, Xue-fei ZHAO. FTIR Analysis of the Correlation Between the Pyrolysis Characteristics and Molecular Structure of Ultrasonic Extraction Derived From Mid-Temperature Pitch[J]. Spectroscopy and Spectral Analysis, 2022, 42(3): 889
    Download Citation