• Journal of Inorganic Materials
  • Vol. 37, Issue 9, 1023 (2022)
Yang WANG1、2, Guangxin FAN1、3、*, Pei LIU2, Jinpei YIN1, Baozhong LIU2, Linjian ZHU3, and Chengguo LUO3
Author Affiliations
  • 11. School of Materials Science and Engineering, Henan Polytechnic University, Jiaozuo 454000, China
  • 22. College of Chemistry and Chemical Engineering, Henan Polytechnic University, Jiaozuo 454000, China
  • 33. Jiaozuo Banlv Nano Materials Engineering Co., Ltd, Jiaozuo 454000, China
  • show less
    DOI: 10.15541/jim20210757 Cite this Article
    Yang WANG, Guangxin FAN, Pei LIU, Jinpei YIN, Baozhong LIU, Linjian ZHU, Chengguo LUO. Microscopic Mechanism of K+ Doping on Performance of Lithium Manganese Cathode for Li-ion Battery [J]. Journal of Inorganic Materials, 2022, 37(9): 1023 Copy Citation Text show less
    XRD patterns and elements composition of as-prepared LKMO-n
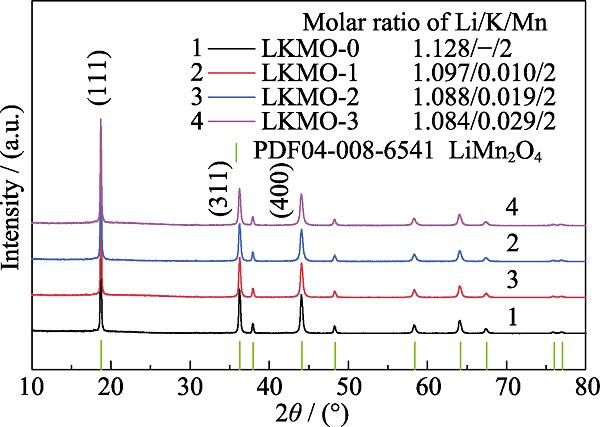
    1. XRD patterns and elements composition of as-prepared LKMO-n
    SEM images of LKMO-0 (a, c) and LKMO-1 (b, d), EDS mappings for LKMO-1 (e) (rectangular area)
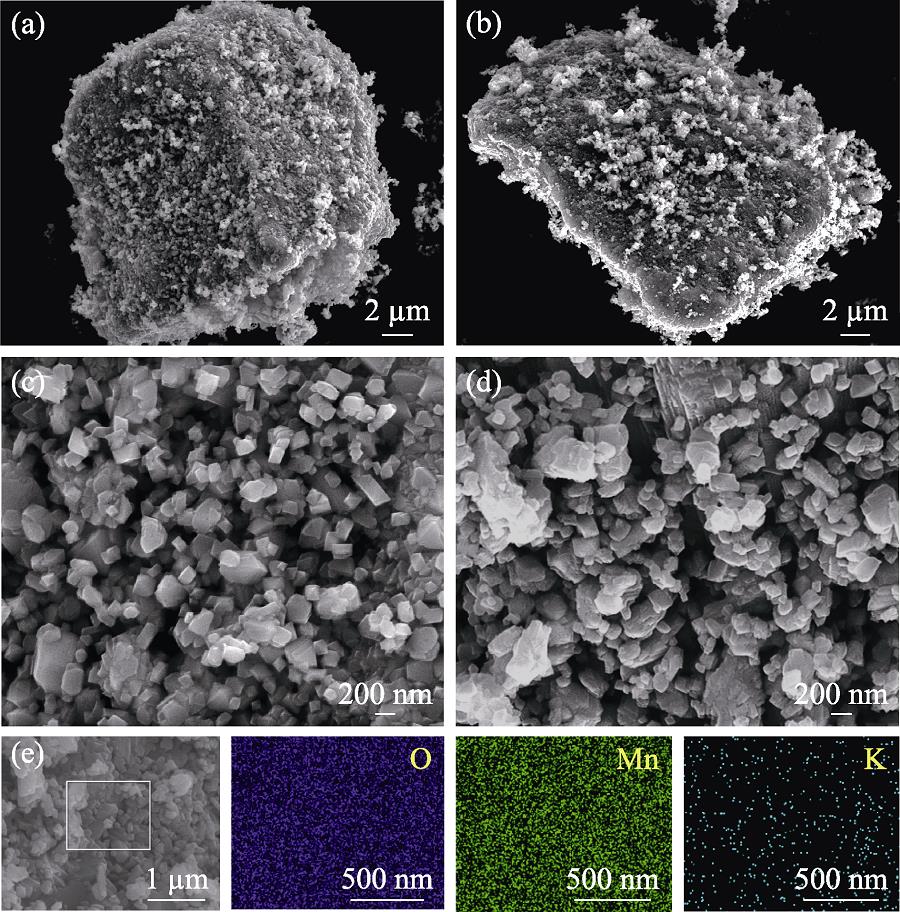
    2. SEM images of LKMO-0 (a, c) and LKMO-1 (b, d), EDS mappings for LKMO-1 (e) (rectangular area)
    (a) XPS full spectrum of LKMO-1, and High-resolution Mn2p XPS spectra of LKMO-0 (b) and LKMO-1 (c)
    3. (a) XPS full spectrum of LKMO-1, and High-resolution Mn2p XPS spectra of LKMO-0 (b) and LKMO-1 (c)
    Rate performances of LKMO-n
    4. Rate performances of LKMO-n
    CV curves of LKMO-0 (a) and LKMO-1 (b) at different scan rates, and plots of ip versus v1/2 for redox reaction (c)
    5. CV curves of LKMO-0 (a) and LKMO-1 (b) at different scan rates, and plots of ip versus v1/2 for redox reaction (c)
    EIS spectra of LKMO-0 and LKMO-1
    6. EIS spectra of LKMO-0 and LKMO-1
    XRD patterns of LKMO-0 and LKMO-1 after 5 cycles at 0.2C and 10C rate
    7. XRD patterns of LKMO-0 and LKMO-1 after 5 cycles at 0.2C and 10C rate
    SEM images of LKMO-0 (a, c, d) and LKMO-1 (b, e) after 30 cycles
    8. SEM images of LKMO-0 (a, c, d) and LKMO-1 (b, e) after 30 cycles
    First charge/discharge curves of LKMO-0 (a) and LKMO-1 (b) at different rates
    S1. First charge/discharge curves of LKMO-0 (a) and LKMO-1 (b) at different rates
    Fitting curves of Z′ versus ω-1/2 of LKMO-0 and LKMO-1
    S2. Fitting curves of Zversus ω-1/2 of LKMO-0 and LKMO-1
    Fitting curves of B2cos2θ versus sin2θ for LKMO-0 and LKMO-1
    S3. Fitting curves of B2cos2θ versus sin2θ for LKMO-0 and LKMO-1
    Sampled(111)/nm FWHM(111)/(°) I(111)/(311)a/nm V/nm3d(Li-O)/nm Mn/Li8aRwpS
    LKMO-00.4740.1511.5290.8220.5560.1872.53%10.231.13
    LKMO-10.4760.1661.5850.8240.5610.1892.29%10.971.13
    LKMO-20.4760.1771.8760.8250.5630.1932.27%10.531.07
    LKMO-30.4770.1791.6780.8260.5640.1912.23%10.911.15
    Table 1. Detailed crystal structural parameters for LKMO-n
    SampleParticle size distribution/μmSBET/(m2·g-1)
    d10d50d90
    LKMO-01.499.2326.11.60
    LKMO-11.718.2724.91.34
    Table 1. Particle size distributions and specific surface areas of LKMO-0 and LKMO-1
    SampleMolar concentration/(mmol·L-1) Molar ratio
    LiKMnLi/K/Mn
    LKMO-05.895-10.4521.128/-/2
    LKMO-15.9140.05510.7751.097/0.010/2
    LKMO-25.8050.10110.6681.088/0.019/2
    LKMO-35.7160.15410.5461.084/0.029/2
    Table 2. Elemental contents of LKMO-n
    SampleBefore charging After charging/ discharging DLi+ /(cm2·s-1)
    RsRctRsRct
    LKMO-04.22193.916.43176.001.20×10-11
    LKMO-13.5972.627.9263.252.35×10-11
    Table 2. Fitting results of EIS and diffusion coefficients of Li-ions of LKMO-0 and LKMO-1
    SampleConditiona/nm d(111)/nm 2θ(111)/(°) FWHM(111)/(°) I(111)/(311)L/nm Strain/%ΔStrain/%
    LKMO-00.2C, 5th 0.8220.47418.6610.1481.38562.70.1530.139
    10C, 5th 0.8130.46918.8230.1551.66368.00.292
    LKMO-10.2C, 5th 0.8240.47618.6790.1711.39451.00.3380.020
    10C, 5th 0.8220.47418.6790.1651.39351.50.358
    Table 3. Crystal structural parameters of LKMO-0 and LKMO-1 after 5 cycles at 0.2C and 10C
    SampleAverage specific discharge capacity/ (mAh·g-1)
    0.2C0.5C1C2C5C10C0.2C
    LKMO-0106.3397.2790.3977.5448.8627.90102.40
    LKMO-1100.1199.1597.2193.3782.6656.5996.83
    LKMO-2106.09101.4790.6072.3744.1224.11103.69
    LKMO-3102.89100.3291.8965.6337.1616.9898.14
    Table 3. Rate performances of LKMO-n
    SampleCharge-discharge efficiency/%
    0.2C0.5C1C2C5C10C
    LKMO-087.8890.8690.9788.8176.8156.76
    LKMO-194.5498.4696.6594.7985.1863.53
    Table 4. Charge-discharge efficiency at different rates for LKMO-0 and LKMO-1
    Yang WANG, Guangxin FAN, Pei LIU, Jinpei YIN, Baozhong LIU, Linjian ZHU, Chengguo LUO. Microscopic Mechanism of K+ Doping on Performance of Lithium Manganese Cathode for Li-ion Battery [J]. Journal of Inorganic Materials, 2022, 37(9): 1023
    Download Citation