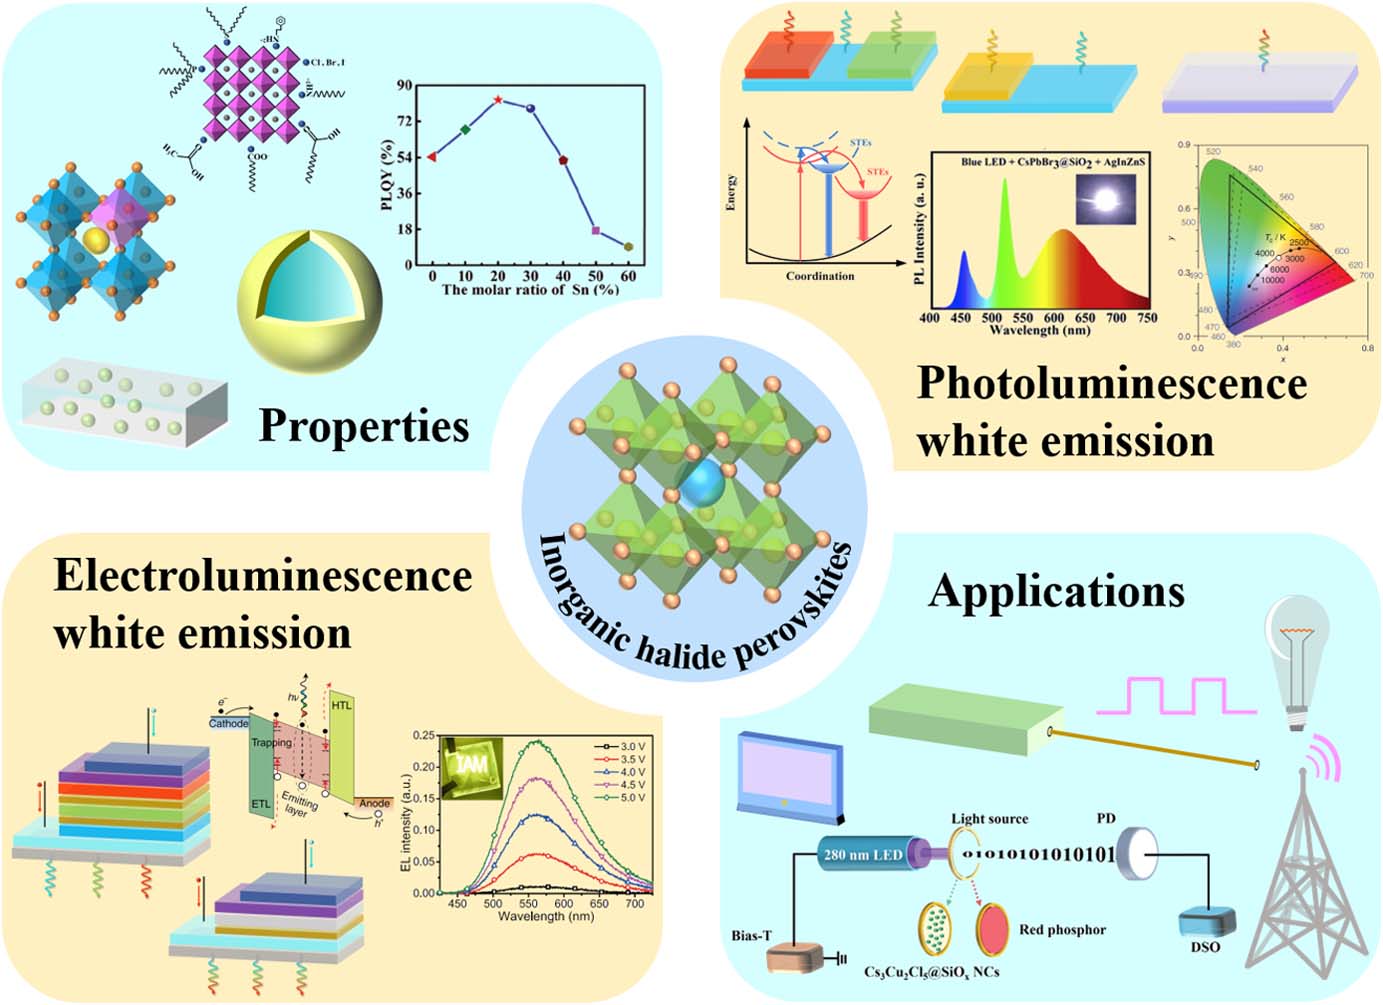
Fig. 1. Summary of the review, which includes materials, photoluminescence, and electroluminescence white emission and application of inorganic halide perovskites.
Fig. 2. (a) Photographs of
CsPbX3 colloidal solution in toluene under 365-nm UV irradiation. (b) PL spectra of
CsPbX3 nanocrystals with varied halide ions. Reproduced with permission [
50]. Copyright 2016, Wiley-VCH GmbH. (c) CCT values of WLEDs as a function of component ratios of green and red perovskites. Reproduced with permission [
51]. Copyright 2016, Wiley-VCH GmbH. (d) Photographs and (e) EL spectra of WLEDs with and without red-emitting
CsPbBrI2 nanocrystals. Reproduced with permission [
52]. Copyright 2016, Royal Society of Chemistry.
Fig. 3. (a) Representative scheme of the surface passivation of
CsPbBr3 nanocrystals from KBr. Reproduced with permission [
59]. Copyright 2021, Wiley-VCH GmbH. (b) HRTEM images and (c) variation of PL spectra of
CsPbCl3,
CsPbBr3, and
CsPbI3 with
ZnX2 treatment. Reproduced with permission [
60]. Copyright 2018, American Chemical Society Publications. (d) EL spectrum of WLEDs based on
CsPbBr3 and KSF phosphors. Reproduced with permission [
61]. Copyright 2021, Elsevier Publishing Group. (e) CIE coordinates and the color gamut of WLEDs based on
CsPbBr3 and KSF phosphors. Reproduced with permission [
62]. Copyright 2021, Springer Nature Group.
Fig. 4. (a) Schematic showing the process for coating
CsPbBr3 nanocrystals at room temperature. Reproduced with permission [
83]. Copyright 2020, Elsevier Publishing Group. (b) HRTEM image of silica-coating
CsPbBr3 nanocrystals. Variety of (c) PL spectra and (d) PL decay curves of intrinsic and coated
CsPbBr3 perovskites. Reproduced with permission [
84]. Copyright 2021, Elsevier Publishing Group. (e) Changes of PL intensity of coated
CsPbBr3,
CsPbBr1.5I1.5, and
CsPbBrI2 perovskites during thermal cycling tests. Reproduced with permission [
85]. Copyright 2021, Royal Society of Chemistry. (f) Stability of PAA-
b-PS-coating
CsPbBr3 nanocrystals in toluene, methanol, ethanol, and water. Reproduced with permission [
86]. Copyright 2021, American Chemical Society Publications. (g) EL spectrum and (h) CIE coordinate of WLEDs based on
CsPbBr3 and red
CsPb(Br0.5I0.5)3 nanocrystals embedded in a zeolite-Y matrix. Reproduced with permission [
87]. Copyright 2017, Wiley-VCH GmbH.
Fig. 5. (a) PL and absorption spectra of
Nd3+-doped
CsPbBr3 nanocrystals with various
Nd3+ amounts. Reproduced with permission [
132]. Copyright 2020, Wiley-VCH GmbH. PL variation of (b) intrinsic and (c) Sn-doped
CsPbBr3 nanocrystals heated at 80°C in air. Reproduced with permission [
133]. Copyright 2021, Royal Society of Chemistry. (d) An energy level diagram of
Mn2+ ions in
CsPb(Cl/Br)3 with increased Br/Cl ratios. Reproduced with permission [
134]. Copyright 2017, American Chemical Society Publications. Evolution of (e) EL spectra and (f) CIE coordinates of WLEDs driven by increasing currents. Reproduced with permission [
135]. Copyright 2019, Wiley-VCH GmbH.
Fig. 6. (a) Schematic of the crystal structure of
Cs3Cu2I5. (b) PL and PLE spectra of
Cs3Cu2I5. (c) Schematic configuration coordinate for the excited-state reorganization in
Cs3Cu2I5. Reproduced with permission [
150]. Copyright 2018, Wiley-VCH GmbH. (d) PL spectra of
Cs3Cu2Cl5 and
CsCu2Cl3 prepared at 120°C and 70°C, respectively. Reproduced with permission [
151]. Copyright 2021, Chinese Laser Press. (e) White PL spectra of Pb-doped
Cs3Cu2Br5 nanocrystals excited at 310 nm. Reproduced with permission [
152]. Copyright 2021, Cell Press. (f) Schematics of crystal structures of
Cs3Bi2X9 (X
= Cl, Br, I). Reproduced with permission [
153]. Copyright 2018, Wiley-VCH GmbH. (g) Evolution of PLQY of
Cs3Bi2X9 and
CsPbBr3 nanocrystals after adding water. Reproduced with permission [
154]. Copyright 2020, Royal Society of Chemistry. (h) CIE coordinates of WLEDs based on
Sb3+-doped
Cs2InCl5·H2O. Reproduced with permission [
155]. Copyright 2020, American Chemical Society Publications.
Fig. 7. (a) Energy-level diagram of
Cs4MnBi2Cl12. Reproduced with permission [
171]. Copyright 2020, Cell Press. (b) PL spectrum of
Sb3+/Bi3+-codoped
Cs2NaInCl6. Reproduced with permission [
172]. Copyright 2021, American Chemical Society Publications. (c) Estimated band gap values of
Cs2AgIn1−xBixCl6 measured from Tauc plots for both direct and indirect transitions. (d) A variety of PL spectra of
Cs2AgIn1−xBixCl6 perovskites. Reproduced with permission [
173]. Copyright 2019, American Chemical Society Publications. (e) Activation energy and PLQYs of
Cs2AgxNa1−xInCl6. Reproduced with permission [
174]. Copyright 2018, Springer Nature Group. (f) Evolution of EL intensity of WLEDs based on
Bi3+−Cs2Ag0.7Na0.3InCl6. Reproduced with permission [
175]. Copyright 2020, American Chemical Society Publications.
Fig. 8. (a) Energy band schematic, (b) variety of CIE coordinates, and (c)
J-V and
L-V curves of electroluminescence WLEDs based on
CsPbBrxCl3−x nanocrystals and MEH:PPV. Reproduced with permission [
187]. Copyright 2017, Wiley-VCH GmbH. (d) Schematic of device structure, (e) photograph of an operating device, and (f) EL spectrum of the WLEDs with the emitting of blend of α- and
δ–CsPbI3. (g)
J-V and
L-V curves, (h) EQE and current efficiency versus current density of the electroluminescence
α- and
δ–CsPbI3 WLEDs. Reproduced with permission [
197]. Copyright 2020, Springer Nature Group.
Fig. 9. (a) Absorption and PL spectra of
CsCu2I3/Cs3Cu2I5 thin films with different CsI/CuI ratios. (b) EQE versus voltage curves for the cold, standard, and warm WLEDs. (c) Evolution of the luminance of the WLEDs based on
CsCu2I3/Cs3Cu2I5. Reproduced with permission [
198]. Copyright 2021, Wiley-VCH GmbH. Time-resolved GIWAXS profiles of
CsCu2I3/Cs3Cu2I5 thin films (d) without and (e) with Tween. (f) Variety of EL spectra for WLEDs driven at different voltages. (g)
J-V and
L-V curves, (h) EQE versus current density curve of WLEDs based on Tween-treated
CsCu2I3/Cs3Cu2I5. Reproduced with permission [
200]. Copyright 2021, Springer Nature Group.
Fig. 10. (a) Schematic of a VLC system. (b) Bit-error rates (BERs) at different data rates, with the forward error correction (FEC) limit labeled. Reproduced with permission [
203]. Copyright 2016, American Chemical Society Publications. (c) Response frequencies of WLEDs driven at increased current. (d) Obtained
−3 dB bandwidths of μLED chips, WLEDs (μLED chips
+ yellow quantum dots), and yellow quantum dots as a function of current. Reproduced with permission [
204]. Copyright 2018, American Chemical Society Publications. (e) Comparisons of modulation bandwidth (3 dB) of the system based on μLED and μLED with different PNC-PMMA films under various currents. (f) Eye diagram of WLEDs at 1.5 and 1.7 Gbit/s. Reproduced with permission [
205]. Copyright 2021, American Chemical Society Publications.
Fig. 11. (a) Schematic diagram of a VLC system. Reproduced with permission [
75]. Copyright 2021, Elsevier Publishing Group. (b) Electrical-optical-electrical frequency response, (c) received SNR, (d) bit loading profile of the VLC system based on WLEDs, and the corresponding constellation diagrams of (e) BPSK, (f) 4QAM, (g) 8QAM, (h) 16QAM, (i) 32QAM, and (j) 64QAM, respectively. Reproduced with permission [
77]. Copyright 2021, Wiley-VCH GmbH.
Fig. 12. (a) Electrical-optical-electrical frequency response of WLEDs based on
Cs3Cu2Cl5 nanocrystals in VLC. Reproduced with permission [
207]. Copyright 2021, Wiley-VCH GmbH. (b) Frequency response with the inset showing an eye diagram and (c) bit loading profile of
Cs3Cu2I5/CsCu2I3WLEDs for VLC. (d) Corresponding constellation diagrams of BPSK, 4QAM, 8QAM, 16QAM. 32QAM, 64QAM, and 128QAM [
208]. Copyright 2022, Wiley-VCH GmbH.
Emitters | CIE Coordinate | CRI | CCT (K) | Luminance () | EQE (%) | Ref. |
---|
| (0.33, 0.34) | | | 350 | | [187] | | (0.28, 0.33) | | | 1200 | | [188] | | (0.32, 0.32) | | | | 0.22 | [189] | | (0.309, 0.323) | | | 267 | 0.042 | [190] | & green phosphors | (0.311, 0.326) | | | 102 | 0.25 | [191] | | (0.34, 0.34) | 75 | 5153 | 275 | 0.015 | [192] | | (0.31, 0.36) | | | 657 | | [193] | | (0.32, 0.31) | 93 | | 938 | 1.2 | [194] | /carbon QDs | (0.41, 0.44) | 92 | 3900 | 140 | 0.06 | [195] | | (0.356, 0.356) | 71 | | 860.9 | 0.22 | [196] | | (0.35, 0.43) | | | 12200 | 6.5 | [197] | | (0.38, 0.42) | 91.6 | 4264 | 145 | 0.15 | [198] | /blue phosphors | (0.27, 0.31) | | 10,000 | | | [150] | | (0.327, 0.348) | 94 | | 352.3 | 0.053 | [199] | | (0.44, 0.53) | | 3650 | 1570 | 3.1 | [200] | | (0.32, 0.32) | 94.5 | 6432 | 158 | 0.08 | [201] |
|
Table 1. Summary of Emitting Materials and Key Parameters of Electroluminescence WLEDs Based on IHPs