
Chaoqi Chen, Xiangchao Meng, Feng Shao, Randi Fu. Infrared and Visible Image Fusion Method Based on Multiscale Low-Rank Decomposition[J]. Acta Optica Sinica, 2020, 40(11): 1110001
- Acta Optica Sinica
- Vol. 40, Issue 11, 1110001 (2020)
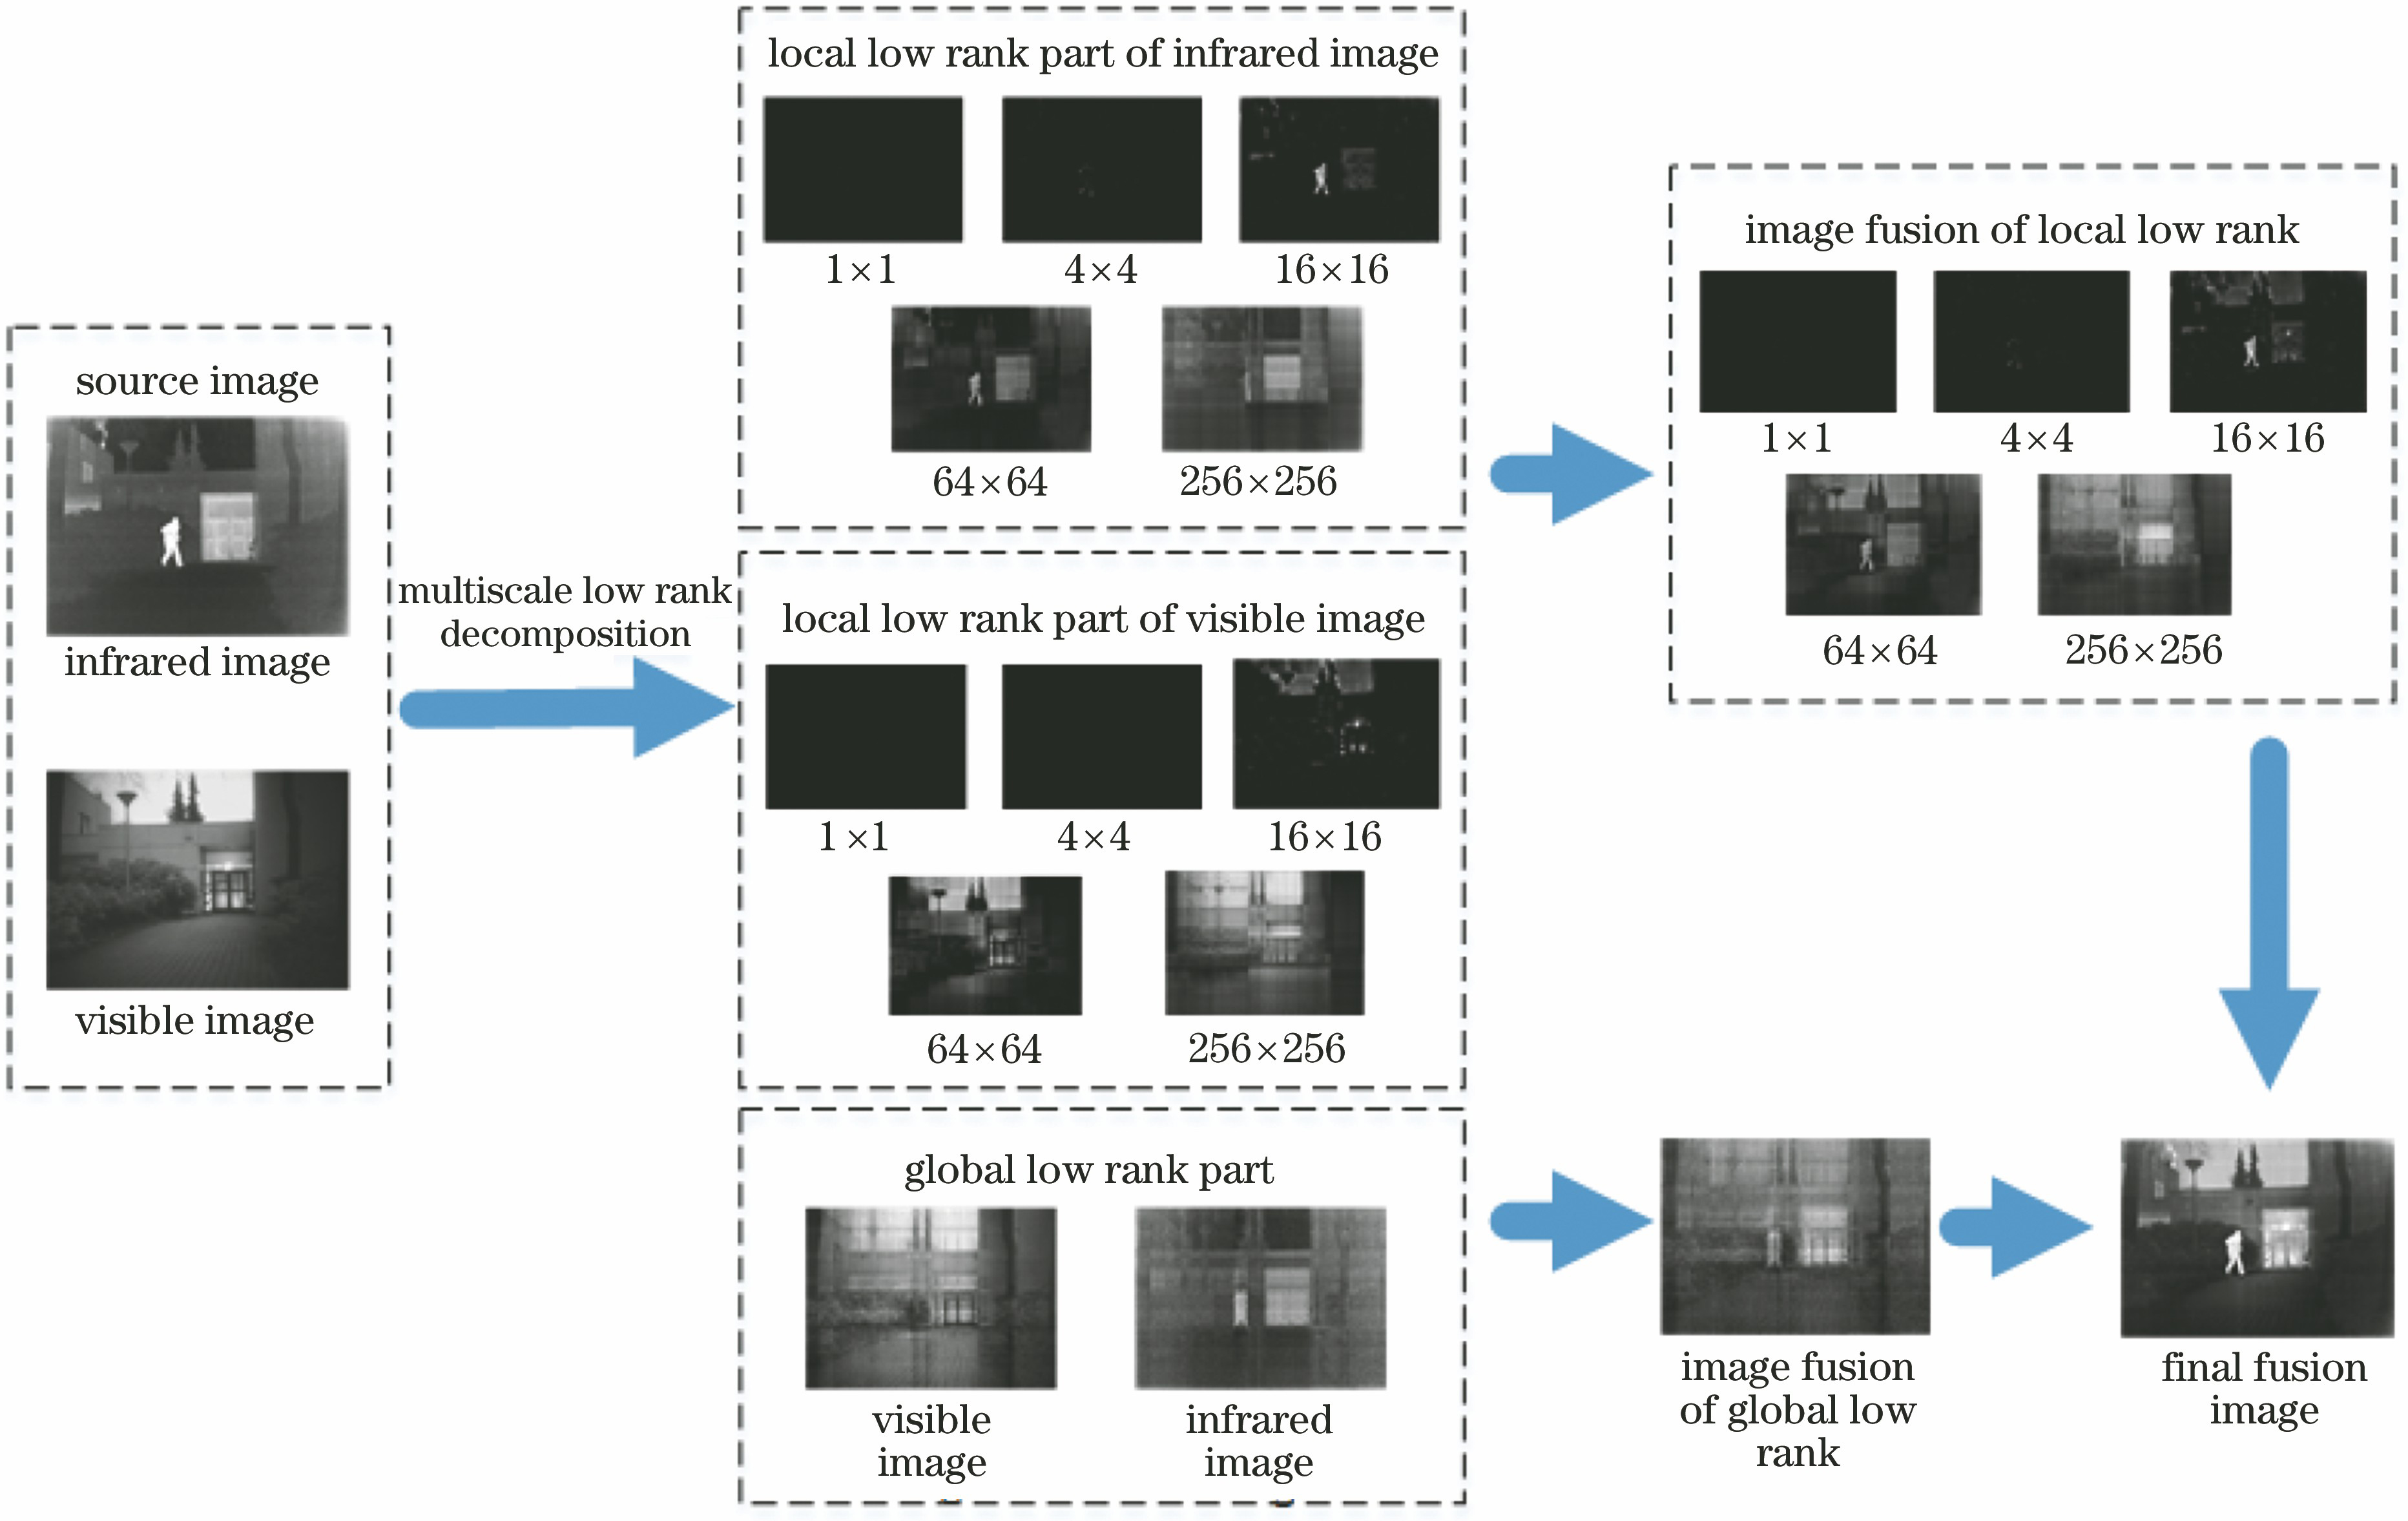
Fig. 1. Flowchart of the proposed fusion method

Fig. 2. Schematic diagram of multiscale low rank decomposition model
Fig. 3. Schematic diagram of infrared image decomposition in Nato_camp
Fig. 4. Saliency images examples of infrared and visible images obtained by 16×16 low-rank block decomposition. (a) Saliency part of the infrared image Tv_3; (b) saliency part of the visible image Tr_3; (c) pixel distribution of infrared and visible images in the same line
Fig. 5. Image fusion results based on 16×16 low rank block decomposition. (a) Fused image F3; (b) pixel distribution of the fused image
Fig. 6. Fusion results in Nato_camp. (a) Visible image; (b) infrared image; (c) ResNet50 method; (d) CNN method; (e) MISF method; (f) GTF method; (g) FPDE method; (h) proposed method
Fig. 7. Fusion results in Bunker. (a) Visible image; (b) infrared image; (c) ResNet50 method; (d) CNN method; (e) MISF method; (f) GTF method; (g) FPDE method; (h) proposed method
Fig. 8. Fusion results in Kaptein_1123. (a) Visible image; (b) infrared image; (c) ResNet50 method; (d) CNN method; (e) MISF method; (f) GTF method; (g) FPDE method; (h) proposed method
Fig. 9. Fusion results in street. (a) Visible image; (b) infrared image; (c) ResNet50 method; (d) CNN method; (e) MISF method; (f) GTF method; (g) FPDE method; (h) proposed method
|
Table 1. Quantitative evaluation results of fused images

Set citation alerts for the article
Please enter your email address
© Copyright 2018-2021 | Chinese Laser Press. All Rights Reserved 沪ICP备15018463号-20