
Myeongseop Kim, Hee Ryung Lee, Razvigor Ossikovski, Aude Malfait-Jobart, Dominique Lamarque, Tatiana Novikova. Optical diagnosis of gastric tissue biopsies with Mueller microscopy and statistical analysis[J]. Journal of the European Optical Society-Rapid Publications, 2022, 18(2): 2022011
Journals >Journal of the European Optical Society-Rapid Publications >Volume 18 >Issue 2 >Page 2022011 > Article
- Journal of the European Optical Society-Rapid Publications
- Vol. 18, Issue 2, 2022011 (2022)
Abstract
1 Introduction
Chronic gastritis is a premalignant condition in a stomach that, if left untreated, favors the development of gastric cancer [
It is known that polarized light is very sensitive to the microstructure of an object under study. The interaction of polarized light beam with a sample changes the polarization state of reflected/transmitted light or even depolarizes it (partially or completely) depending on the optical properties of a sample. Thus, by measuring these modulations or loss of polarization, we may deduce the polarimetric properties (e.g. diattenuation, birefringence, depolarization [
The basics of Mueller polarimetry, the description of gastric tissue samples, the optical instrument (Mueller Matrix (MM) microscope), and the algorithms of data post-processing (non-linear compression of MM data and regression model for image segmentation) are provided in
2 Methods and materials
2.1 Mueller polarimetry
Within the framework of the Stokes–Mueller formalism [
2.2 Samples
Thin sections of human gastric tissue with different pathological conditions (control healthy, gastritis, and cancer) were prepared from the random biopsies taken during the standard endoscopy tests. Patients with diagnosed chronic gastritis were enrolled from the cohort GASTRIMED (ClinicalTrials.gov identifier: NCT02325323 [
Two adjacent thin tissue sections of 6 μm thickness were prepared for each of three biopsy specimens. One section was stained with hematoxylin and eosin classical protocol (H&E staining) and went through the conventional histology analysis, the gold standard technique for assessing pathological status of tissue. The adjacent unstained gastric tissue section was dewaxed, and its polarimetric properties were measured with a custom-built MM microscope operating in transmission geometry.
2.3 Mueller matrix microscope
The detailed description of this instrument is provided elsewhere [
2.4 Data post-processing
Mueller matrix contains all information on polarization and depolarization properties of a sample; however, the physical interpretation of the elements of Mueller matrix is not always straightforward. We used the differential (or logarithmic) Mueller matrix decomposition (DMMD) method described in [
Regression analysis is a supervised predictive machine learning approach that evaluates the relation between the independent variables in a given dataset and the dependent variables labelled as the target. There are different types of regression analysis techniques (e.g. linear regression, logistic regression, polynomial regression, etc.) that are applied for data processing [
In our study we applied a polynomial regression model for the diagnostic segmentation of polarimetric images of thin gastric tissue sections [
To minimize the MSE, we set the derivative to zero and solve for
The elements of vector
Then the built regression model with the feature space Z of training data and the target value vector
3 Results and discussion
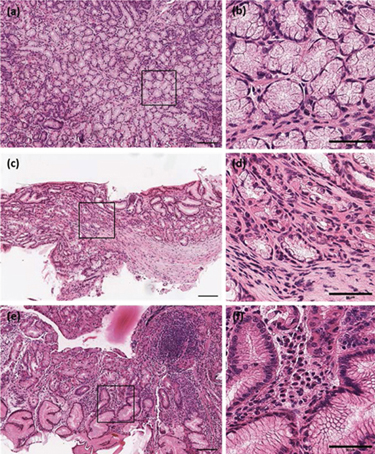
The microscopy images of the H&E stained thin sections of three different types of human gastric endoscopic biopsies: healthy control, chronic gastritis, and gastric cancer tissue are shown in
![]()
Figure 1.White light microscopy images of H&E stained thin sections of three different human gastric endoscopy biopsies: (a) healthy control (c) chronic gastritis; (e) gastric cancer. The insets (b), (d) and (f) show the enlarged black box zones of the images (a), (b) and (e), respectively. The scale bar is 200 μm in (a), (c) and (e) and 100 μm in (b), (d) and (f).
The corresponding adjacent unstained gastric tissue sections were measured with a custom-built MM microscope. The recorded Mueller matrix images were decomposed by applying DMMD and the maps of retardance, diattenuation and depolarization were calculated. Different type of contrast was observed compared to the white light microscopy images.
![]()
Figure 2.Mueller microscopy images of unstained thin sections of three different human gastric endoscopy biopsies. Normalized transmitted intensity – (a) healthy control, (c) chronic gastritis; (e) gastric cancer. Map of scalar retardance – (b) healthy control, (d) chronic gastritis; (f) gastric cancer. Field of view is about 250 μm in diameter.
Several pixels rendered in red in the images of linear retardance represent high values of these parameters, whereas these pixels are not contrasted in the corresponding transmitted intensity image. The phenomenon of the intra-nuclear birefringent inclusions (IBI), found in tissue sections prepared using paraffin embedding step, is commonly considered to be a tissue processing artifact. This artifact is related to the presence of residual paraffin left in some cell nuclei because of insufficient deparaffinization and clearing during tissue processing. Based on the results of [
The polynomial regression model was built and applied to generate the predicted microscopic images of unstained thin sections of gastric tissue biopsies recorded with transmission Mueller microscope. First, we selected the region of interest (ROI) to build the regression model. The original image resolution is 800 × 600 pixels, and the selected ROI contains 400 × 300 pixels (see
![]()
Figure 3.Selection of the region of interest (red box – 400 × 300 pixels, left panel) and corresponding training dataset (size of 4 × 400 × 300) – the images of transmitted intensity, linear retardance, linear dichroism, and circular depolarization of healthy control gastric tissue.
As was mentioned above, it is required to set the target image because the data regression technique is a supervised machine learning algorithm. The pixels corresponding to the linear retardance values >0.1 radians were tagged with the label 3. It is worth to note that those pixels also demonstrate large value of dichroism and large absolute value of depolarization. Since the glands and the mucus cells within the glands have similar optical properties, the pixels with the normalized intensity values > 0.65 were tagged with the label 2 in the target image. The remaining pixels were tagged with the label 1. The defined target image demonstrates the enhanced contrast between the connective tissue and zones with large polarimetric values (see
![]()
Figure 4.The main steps of building the regression model using training set of the intensity and polarimetric images of healthy control gastric tissue section.
Then the polynomial regression model described by equations
The prediction of the regression model for the healthy control gastric tissue section is shown in
![]()
Figure 5.Predicted images (400 × 300 pixels) of gastric tissue sections: (a) healthy, (b) chronic gastritis, (c) gastric cancer), (d–f) histograms of the corresponding predicted images; (g–i) insets with the enlarged view of the second Gaussian peak.
We also applied the regression model trained on the images of healthy control tissue sections to the images of chronic gastritis (
We performed two Gaussians fit to the histograms of predicted image values for three different types of the gastric samples (e.g. healthy, chronic gastritis, and gastric cancer) to compare them quantitatively. We focus on the analysis of the position, width and height of the Gaussian peaks. The parameters of a first Gaussian do not demonstrate significant variation with pathological status of gastric tissue. The position of second peak and its full width at half maximum (FWHM) also do not show strong variations, being 2.45 and 0.2, respectively. On the contrary, the height of a second Gaussian increases for chronical gastritis and cancerous gastric tissue sections compared to healthy gastric tissue. The value of height of a second peak is equal to 80 for healthy control gastric tissue. This value increases up to 150 (almost twice) for the chronic gastritis tissue and becomes equal to 200 for gastric cancer tissue. We suggest using this parameter as a quantitative metric for unstained gastric tissue section diagnosis in order to provide an accurate grading of gastric tissue inflammation to support pathologist’s analysis.
Conclusions
The ultimate goal of this study is the development of the procedure for an automated fast analysis of the polarimetric images of thin unstained sections of gastric tissue biopsies for tissue diagnosis (i.e., detection of different pathology conditions: gastric cancer, inflammation, gastritis and its quantification). For this purpose, we have implemented and tested an automated image processing algorithm based on the regression model of intensity, total scalar retardance, and depolarization images obtained with MM microscopy for gastric tissue diagnosis to support the gold standard analysis by a pathologist. The polynomial regression model was implemented for the image segmentation. Further, the statistical analysis of the predicted images was performed by a two-Gaussian fit to provide the quantitative metrics for gastric tissue diagnosis. The height of a second Gaussian peak was shown to be sensitive to the pathological status of measured sample, thus, holding the promise to become a quantitative metric for the digital histology analysis. It is worth to mention that the suggested approach does not require tissue staining and, thus, can reduce the time of tissue section preparation.
The perspectives for future studies include the gold standard histology analysis of the pathological status of high-paraffin intake cells. We expect the high value of scalar retardance for the high-paraffin intake cells to be a possible marker of the inflammatory cells. The statistical analysis of the predicted images has to be performed on a larger dataset of gastric tissue biopsies at different health conditions to test the detection performance of optical polarimetric diagnosis and estimate the variability and standard deviation of the suggested metrics of tissue pathological status. It will be the subject of our subsequent studies.
The obtained results suggest that Mueller-matrix polarimetry can be an effective approach for screening optical anisotropy variations in tissue-like highly scattering media, with a high potential in clinical application for diagnosis of cancerous tissues. Using thick blocks of excised tissue for the preliminary optical analysis by pathologist may considerably reduce the time and cost of diagnostics. To capitalize on our initial findings the measurements and statistical, correlation and fractal analysis of larger number of paraffin-embedded tissue samples will be undertaken in a future work.
References
[1] P. Sipponen. Atrophic gastritis as a premalignant condition. Ann. Med., 21, 287-290(1989).
[2] R.M. Genta, M. Rugge. Assessing risks for gastric cancer: New tools for pathologists. World J. Gastroenterol., 12, 5622-5627(2006).
[3] H.A. Carpenter, N.J. Talley. Gastroscopy is incomplete without biopsy: clinical relevance of distinguishing gastropathy from gastritis. Gastroenterology, 108, 917-924(1995).
[4] P. Correa, B. Piazuelo. The gastric precancerous cascade. J. Dig. Dis., 13, 2-9(2012).
[5] P. Sipponen, H.I. Maaroos. Chronic gastritis. Scand. J. Gastroenterol., 50, 657-667(2015).
[6] V. Baxi, R. Edwards, M. Montalto, S. Saha. Digital pathology and artificial intelligence in translational medicine and clinical practice. Mod. Pathol., 35, 23-32(2022).
[7] D.H. Goldstein. Polarized light(2010).
[8] T. Novikova, P. Bulkin. Inverse problem of Mueller polarimetry for metrological applications. J. Inverse Ill-Posed Probl., 29, 759-774(2021).
[9] B. Kaplan, T. Novikova, A. De Martino, B. Drévillon. Characterization of bidimensional gratings by spectroscopic ellipsometry and angle-resolved Mueller polarimetry. Appl. Opt., 43, 1233-1240(2004).
[10] M. Sarkar, N. Gupta, M. Assaad. Monitoring of fruit freshness using phase information in polarization reflectance spectroscopy. Appl. Opt., 58, 6396-6405(2019).
[11] M. Peyvasteh, A. Popov, A. Bykov, A. Pierangelo, T. Novikova, I. Meglinski. Evolution of raw meat polarization-based properties by means of Mueller matrix imaging. J. Biophotonics, 4, e202000376(2021).
[12] A.A. Blokhina, V.A. Ryzhova, V.V. Korotaev, M.A. Kleshchenok. The meat product quality control by a polarimetric method. Proc. SPIE Medical Applications of Laser-Generated Beams of Particles IV: Review of Progress and Strategies for the Future, 10239, 102390K(2017).
[13] W. Brullot, M.K. Vanbel, T. Swusten, T. Verbiest. Resolving enantiomers using the optical angular momentum of twisted light. Sci. Adv., 2, e1501349(2016).
[14] K. Sugano, T. Kato, K. Suzuki, K. Keiko, T. Sujaki, T. Mano. High throughput solubility measurement with automated polarized light microscopy analysis. J. Pharm. Sci., 95, 2115-2122(2006).
[15] J. Chue-Sang, N. Holness, M. Gonzalez, J. Greaves, I. Saytashev, S. Stoff, A. Gandjbakhche, V.V. Chernomordik, G. Burkett, J.C. Ramella-Roman. Use of Mueller matrix colposcopy in the characterization of cervical collagen anisotropy. J. Biomed. Opt., 23, 1-9(2018).
[16] P. Schucht, H.R. Lee, M.H. Mezouar, E. Hewer, A. Raabe, M. Murek, I. Zubak, J. Goldberg, E. Kovari, A. Pierangelo, T. Novikova. Visualization of white matter fiber tracts of brain tissue sections with wide-field imaging Mueller polarimetry. IEEE Trans. Med. Imaging, 39, 4376-4382(2020).
[17] F. Beer, A. Wartak, N. Pircher, S. Holzer, J. Lammer, G. Schmidinger, B. Baumann, M. Pircher, C.K. Hitzenberger. Mapping of corneal layer thicknesses with polarization-sensitive optical coherence tomography using a conical scan pattern. Invest. Ophthalmol. Vis. Sci., 59, 5579-5588(2018).
[18] M. Borovkova, A. Bykov, A. Popov, A. Pierangelo, T. Novikova, J. Pahnke, I. Meglinski. Evaluating β-amyloidosis Progression in Alzheimer’s Disease with Mueller Polarimetry. Biomed. Opt. Express, 11, 4509-4519(2020).
[19] D. Ivanov, V. Dremin, A. Bykov, E. Borisova, T. Genova, A. Popov, R. Ossikovski, T. Novikova, I. Meglinski. Colon cancer detection via Poincaré sphere representation and 2D polarimetric mapping of ex vivo colon sample. J. Biophotonics, 13, e202000082(2020).
[20] H. He, M. Sun, N. Zeng, E. Du, S. Liu, Y. Guo, J. Wu, Y. He, H. Ma. Mapping local orientation of aligned fibrous scatterers for cancerous tissues using backscattering Mueller matrix imaging. J. Biomed. Opt., 19, e202000082(2014).
[21] V.A. Ushenko, B.T. Hogan, A. Dubolazov, A.V. Grechina, T.V. Boronikhina, M. Gorsky, A.G. Ushenko, Y.O. Ushenko, A. Bykov, I. Meglinski. Embossed topographic depolarisation maps of biological tissues with different morphological structures. Sci. Rep., 11, 3871(2021).
[22] V.A. Ushenko, B.T. Hogan, A. Dubolazov, G. Piavchenko, S.I. Kuznetsov, A.G. Ushenko, Y.O. Ushenko, M. Gorsky, A. Bykov, I. Meglinski. 3D Mueller matrix mapping of layered distributions of depolarisation degree for analysis of prostate adenoma and carcinoma diffuse tissues. Sci. Rep., 11, 5162(2021).
[23] L. Trifonyuk, A. Sdobnov, W. Baranowski, V. Ushenko, O. Olar, A. Dubolazov, L. Pidkamin, M. Sidor, O. Vanchuliak, A. Motrich, M. Gorsky, I. Meglinski. Differential Mueller matrix imaging of partially depolarizing optically anisotropic biological tissues. Lasers Med. Sci., 35, 877-891(2020).
[24] M. Peyvasteh, A. Dubolazov, A. Popov, A. Ushenko, Y. Ushenko, I. Meglinski. Two-point Stokes vector diagnostic approach for characterization of optically anisotropic biological tissues. J. Phys. D: Appl. Phys., 53, 395401(2020).
[25] M. Borovkova, L. Trifonyuk, V. Ushenko, A. Dubolazov, O. Vanchulyak, G. Bodnar, Y. Ushenko, O. Olar, A. Ushenko, M. Sakhnovskiy, A. Bykov, I. Meglinski. Mueller-matrix-based polarization imaging and quantitative assessment of optically anisotropic polycrystalline networks. PLoS ONE, 14, e0214494(2019).
[26] H.R. Lee, T.S.H. Yoo, P. Li, C. Lotz, F. Kai Groeber-Becker, S. Dembski, E. Garcia-Caurel, R. Ossikovski, T. Novikova. Mueller microscopy of anisotropic scattering media: theory and experiments. Proc. SPIE Unconventional Optical Imaging, 10677, 1067718(2018).
[27] P. Li, H.R. Lee, S. Chandel, C. Lotz, F. Kai Groeber-Becker, S. Dembski, R. Ossikovski, H. Ma, T. Novikova. Analysis of tissue microstructure with Mueller microscopy: logarithmic decomposition and Monte Carlo modeling. J. Biomed. Opt., 25, 015002(2020).
[29] T. Bazin, S.E. Martinez-Herrera, A. Jobart-Malfait, Y. Benezeth, M. Boffety, C. Julié, J.F. Emile, V. Michel, F. Goudail, E. Touati, F. Marzani, D. Lamarque. Multispectral imaging detects gastritis consistently in mouse model and in humans. Sci. Rep., 10, 20047(2020).
[31] H.R. Lee, P. Li, T.S.H. Yoo, C. Lotz, F. Kai Groeber-Becker, S. Dembski, E. Garcia-Caurel, R. Ossikovski, H. Ma, T. Novikova. Digital histology with Mueller microscopy: how to mitigate an impact of tissue cut thickness fluctuations. J. Biomed. Opt., 24, 076004(2019).
[32] H.R. Lee, I. Saytashev, V.N. Du Le, M. Mahendroo, J.C. Ramella-Roman, T. Novikova. Mueller matrix imaging for collagen scoring in mice model of pregnancy. Sci. Rep., 11, 15621(2021).
[33] E. Compain, S. Poirier, B. Drevillon. General and self-consistent method for the calibration of polarization modulators, polarimeters, and Mueller-matrix ellipsometers. Appl. Opt., 38, 3490-3502(1999).
[34] J.J. Gil-Perez, R. Ossikovski. Polarized Light and the Mueller Matrix Approach(2016).
[35] A. Schneider, G. Hommel, M. Blettner. Linear regression analysis: part 14 of a series on evaluation of scientific publications. Dtsch. Arztebl. Int., 107, 776-782(2010).
[36] R. Silhavy, P. Silhavy, Z. Prokopova. Analysis and selection of a regression model for the use case points method using a stepwise approach. J. Syst. Softw., 125, 1-14(2017).
[37] T.V.N. Prabhakar, G. Xavier, P. Geetha, K. Soman. Spatial preprocessing based multinomial logistic regression for hyperspectral image classification. Procedia Comput. Sci., 46, 1817-1826(2015).
[38] K.K. Baseer, V. Neerugatti, S. Tatekalva, A.A. Babu. Analysing various regression models for data processing. Int. J. Innov. Technol. Exploring Eng., 8, 731-736(2019).
[39] I.H. Witten, E. Frank, M.A. Hall. Data mining: practical machine learning tools and techniques(2011).
[40] L. Lo Vercio, K. Amador, J.J. Bannister, S. Crites, A. Gutierrez, M.E. MacDonald, J. Moore, P. Mouches, D. Rajashekar, S. Schimert, N. Subbanna, A. Tuladhar, N. Wang, M. Wilms, A. Winder, N.D. Forkert. Supervised machine learning tools: a tutorial for clinicians. J. Neural. Eng., 17, 062001(2020).
[41] F. Akdeniz, H. Erol. Mean squared error matrix comparisons of some biased estimators in linear regression. Commun. Stat. Theory Methods, 32, 2389-2413(2003).
[42] A. Vitkunaite, A. Laurinaviciene, B. Plancoulaine, A. Rasmusson, R.M.S. Levenson, A. Laurinavicius. Intranuclear birefringent inclusions in paraffin sections by polychromatic polarization microscopy. Sci. Rep., 11, 6275(2021).
[43] G. Pennelli, F. Grillo, F. Galuppini, G. Ingravallo, E. Pilozzi, M. Rugge, R. Fiocca, M. Fassan, L. Mastracci. Gastritis: update on etiological features and histological practical approach. Pathologica, 112, 153-165(2020).
[44] U. Roessner, A. Nahid, B. Chapman, A. Hunter, M. Bellgard. Metabolomics – the combination of analytical biochemistry, biology and informatics. Scientific Fundamentals of Biotechnology, 1, 447(2011).


Set citation alerts for the article
Please enter your email address

© Copyright 2018-2021 | Chinese Laser Press. All Rights Reserved 沪ICP备15018463号-20