
Hai Liu, Cancan Chen, Wen Zhang, Haoran Wang, Shoufeng Tang. Methane Sensing Measurement Based on Photonic Crystal Fiber Four-Wave Mixing Effect[J]. Laser & Optoelectronics Progress, 2020, 57(19): 191203
- Laser & Optoelectronics Progress
- Vol. 57, Issue 19, 191203 (2020)
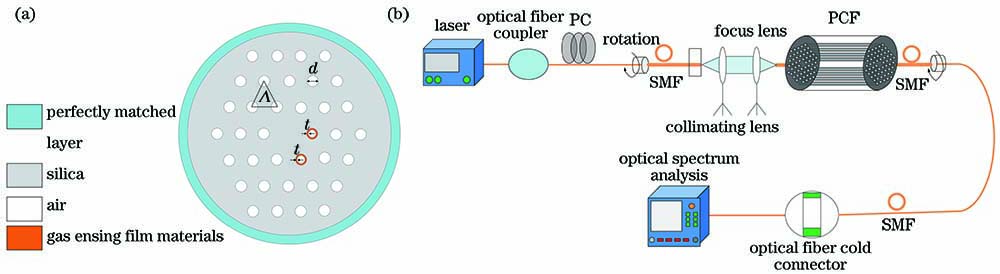
Fig. 1. Cross-section of PCF and experimental principle diagram of the sensor. (a) Cross-section of PCF; (b) experimental principle diagram of the sensor
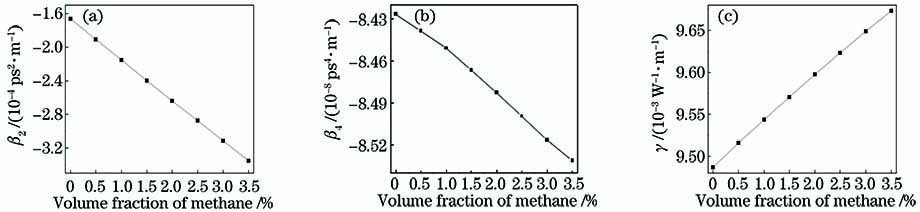
Fig. 2. Plots of the variations of β2, β4, and γ with methane concentrations. (a) Variation of β2; (b) variation of β4; (c) variation of γ
Fig. 3. Gas-sensitivity graph of Stokes and anti-Stokes spectra。(a) Phase mismatch plots for different methane concentrations; (b) DFWM gain plot of the Stokes and anti-Stokes signals near the pump wavelength; (c) peak wavelength of the gain signal for different methane concentrations; (d) relationship between wavelength shift and methane concentrations at a pump wavelength of 1080 nm
Fig. 4. Phase mismatch plots as well as Stokes and anti-Stokes signal gain plots obtained at different film thicknesses. (a) Phase mismatch plots; (b) Stokes and anti-Stokes signal gain plots
Fig. 5. Phase mismatch plots as well as Stokes and anti-Stokes signal gain plots obtained at different film thicknesses and methane concentrations. (a) Phase mismatch plots; (b) Stokes and anti-Stokes signal gain plots
Fig. 6. Phase mismatch plots as well as Stokes and anti-Stokes signal gain plots obtained at different pump wavelengths. (a) Phase mismatch plots; (b) Stokes and anti-Stokes signal gain plots
Fig. 7. Phase mismatch plots as well as Stokes and anti-Stokes signal gain plots obtained at different pump wavelengths and methane concentrations. (a) Phase mismatch plots; (b) Stokes and anti-Stokes signal gain plots
Fig. 8. Plots of the variation of β2, β4, γ, κ, DFWM gain plot of the Stokes and anti-Stokes spectra, peak movement curves and sensitivity fitting curves at a pump wavelength of 1079 nm. (a) β2; (b) β4; (c) γ; (d) κ; (e) Stokes and anti-Stokes spectra gains plots; (f) peak movement curves; (g) sensitivity fitting curves
Fig. 9. Movement of Stokes and Anti-Stokes Spectra when methane volume fraction changes from 0% to 0.05%
|
Table 1. Structural parameters of the sensor
|
Table 2. Comparison of photonic crystal fiber sensor

Set citation alerts for the article
Please enter your email address
© Copyright 2018-2021 | Chinese Laser Press. All Rights Reserved 沪ICP备15018463号-20