
Rui Shu, Wei Chen, Jing-Hua Xiao. Optimizing synchronizability of multiplecoupled star networks [J]. Acta Physica Sinica, 2019, 68(18): 180503-1
- Acta Physica Sinica
- Vol. 68, Issue 18, 180503-1 (2019)
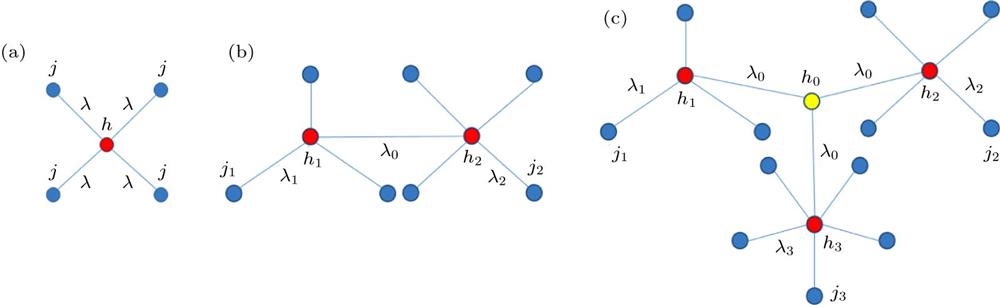
Fig. 1. Coupled star networks: (a) Single star network; (b) two coupled networks; (c) multiple coupled networks.耦合星型网络示意图 (a)单个星型网络; (b)两个耦合星型网络; (c)多个耦合星型网络
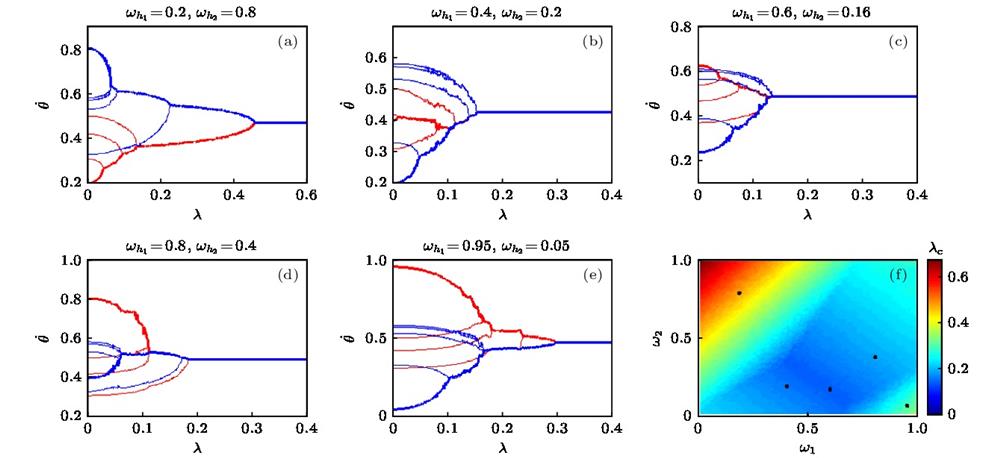
Fig. 2. Numerical results for
,
. (a)−(e) Average frequency versus coupling strength for two coupled star networksS 1 (red) and S 2 (blue). The thick and thin lines respectively represent the center nodes and leaf nodes. (f) The critical coupling strength
versus
. The value of
is shown according to the colorbar.
,
情况下的数值计算结果 (a)−(e)不同中心节点频率情况下的节点平均频率随耦合强度的变化, 其中红线和蓝线分别表示(a)−(e)不同中心节点频率情况下的节点平均频率随耦合强度的变化, 其中红线和蓝线分别表示S 1和S 2的节点, 粗线和细线分别表示中心节点和叶子节点; (f)系统临界耦合强度
随
值的变化, 越靠近冷色调表示临界耦合强度越小
Fig. 3. (a)−(c)
versus
. (d)
versus
, where
; the parameter space can be divided into different regions according to the value of
; the red lines denote
; the black lines denote
; the white lines denote
.
(a)−(c)分别表示
随
值的变化情况; (d)
随
值的变化情况,
,
参数平面被分为不同的区域, 两条红线表示
与
相等的区域, 两条黑线表示
与
相等的区域, 白线表示
与
相等的区域
Fig. 4. Relationship between
and
.
系统的临界耦合强度
随
值的变化情况
Fig. 5. Logarithmic variance of average frequency in parameter space of coupling strength for
: (a)
; (b)
; (c)
; (d)
. The smaller logarithmic variance of average frequency indicates better synchronization. Black line, white line and green line represent the theoretical critical coupling strength for synchroniation
,
,
, respectively.
时, 不同耦合强度参数区间下, 节点平均频率的方差的对数值 (a)
; (b)
; (c)
; (d)
, 颜色越靠近冷色调表示系统的同步程度越高, 黑线、白线、绿线分别表示理论推导出的
,
,
Fig. 6. Numerical results and theoretical results for
,
,
[0.77, 0.80, 0.19, 0.49]: (a) The critical coupling strength for synchronization versus the summation of central node frequencies; the numerical results are shown in the circle and the theoretical ones are shown in the solid lines; (b) the logarithmic variance of average frequency in parameter space of
for given
.
参数为
[0.77, 0.80, 0.19, 0.49]时的数值计算结果 (a)控制所有耦合强度相等时, 系统的同步临界耦合强度随
的和的关系图, 数值计算结果如圆圈所示, 理论推导结果如实线所示; (b)当固定
, 改变参数
时, 所有节点平均频率的方差的对数结果, 绿线和白线分别是理论得到的

Set citation alerts for the article
Please enter your email address
© Copyright 2018-2021 | Chinese Laser Press. All Rights Reserved 沪ICP备15018463号-20