
Xin Li, Qinmiao Chen, Xue Zhang, Ruizhe Zhao, Shumin Xiao, Yongtian Wang, Lingling Huang. Time-sequential color code division multiplexing holographic display with metasurface[J]. Opto-Electronic Advances, 2022, 6(8): 220060
- Opto-Electronic Advances
- Vol. 6, Issue 8, 220060 (2022)
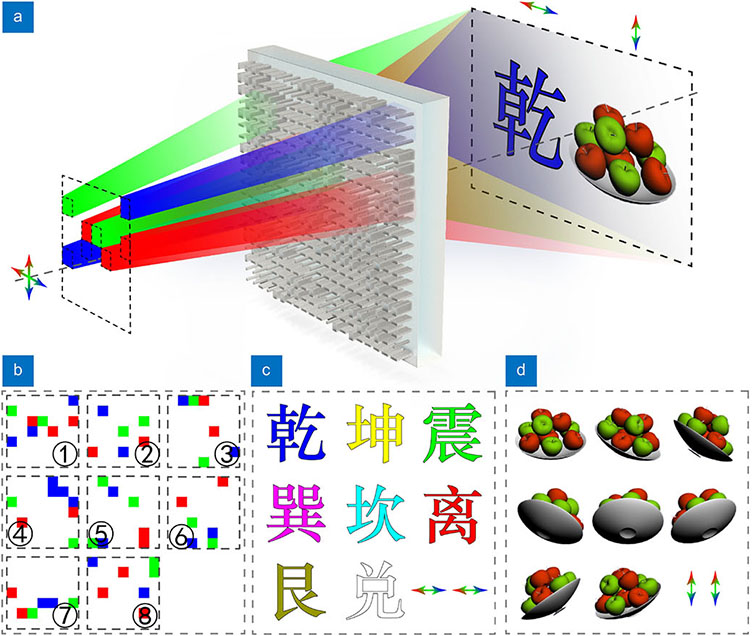
Fig. 1. (a ) The schematic of color holographic display based on CDM and polarization multiplexing. The target color image can be reconstructed only when the correct code key reference illuminates on the metasurface with a correct linear polarization state. (b ) Exhibits eight color code references. (c ) and (d ) Color images encoded and recorded for horizontal and vertical polarization channels, respectively.
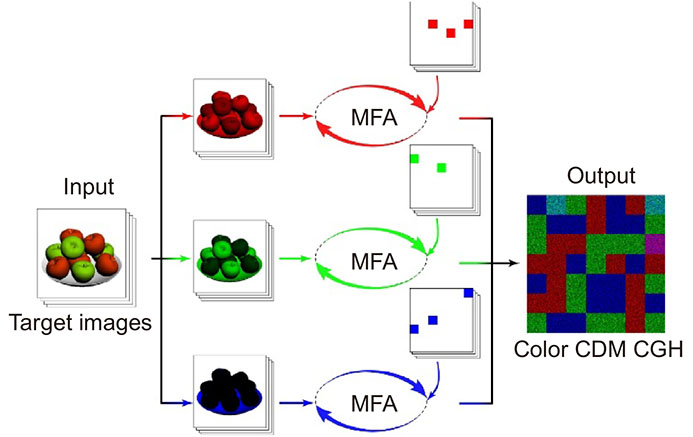
Fig. 2. Flowchart of optimization algorithm for dynamic multiwavelength CDM CGHs generation. MFA represents modified Fidoc algorithm for CDM holography according to ref.41. The target images are divided into three series of monochromic images for different color components, and they are encoded and synthesized as a multiwavelength CDM CGH.
Fig. 3. (a ) Schematic illustration of a titanium dioxide nanorod fabricated on a glass substrate, where H represents the height (600 nm for the samples), P denotes the period of a unit cell (360 nm in our verification), and W and L are the width and length of nanorods, respectively, whose ranges are from 50 nm to 310 nm. (b –g ) The simulation scanning results obtained via RCWA for parameters optimizations involving incident wavelengths of 633 nm, 532 nm, and 460 nm. (b–d) and (e–g) are amplitude and phase transmission coefficientstxx of nanorods, respectively.
Fig. 4. (a –b ) Top and oblique views of scanning electron microscopy images of fabricated samples, where the scale bar represents denotes 1 μm. (c ) Experimental setup. LS, the supercontinuum laser source; OB1 and OB2, objective lens; PH, pinhole; L1–L4, convex lenses; P1 and P2, polarizer and analyzer; HWP, half-wave plate; DMD, digital micro-mirror device; AP, continuously variable iris diaphragm; MS, metasurface; CCD, charge coupled device.
Fig. 5. Experimental results of multiplexing metasurface holographic color display. The images on the first row are reconstructed with horizontal linear polarization state and four frames from a video with vertical linear polarization are shown on the second row (see Movie S1).

Set citation alerts for the article
Please enter your email address
© Copyright 2018-2021 | Chinese Laser Press. All Rights Reserved 沪ICP备15018463号-20