
You-lie JIANG, Shi-ping ZHU, Chao TANG, Bi-yun SUN, Liang WANG. Fast Prediction Method of Thermal Aging Time and Furfural Content of Insulating Oil Based on Near-Infrared Spectroscopy[J]. Spectroscopy and Spectral Analysis, 2020, 40(11): 3515
- Spectroscopy and Spectral Analysis
- Vol. 40, Issue 11, 3515 (2020)
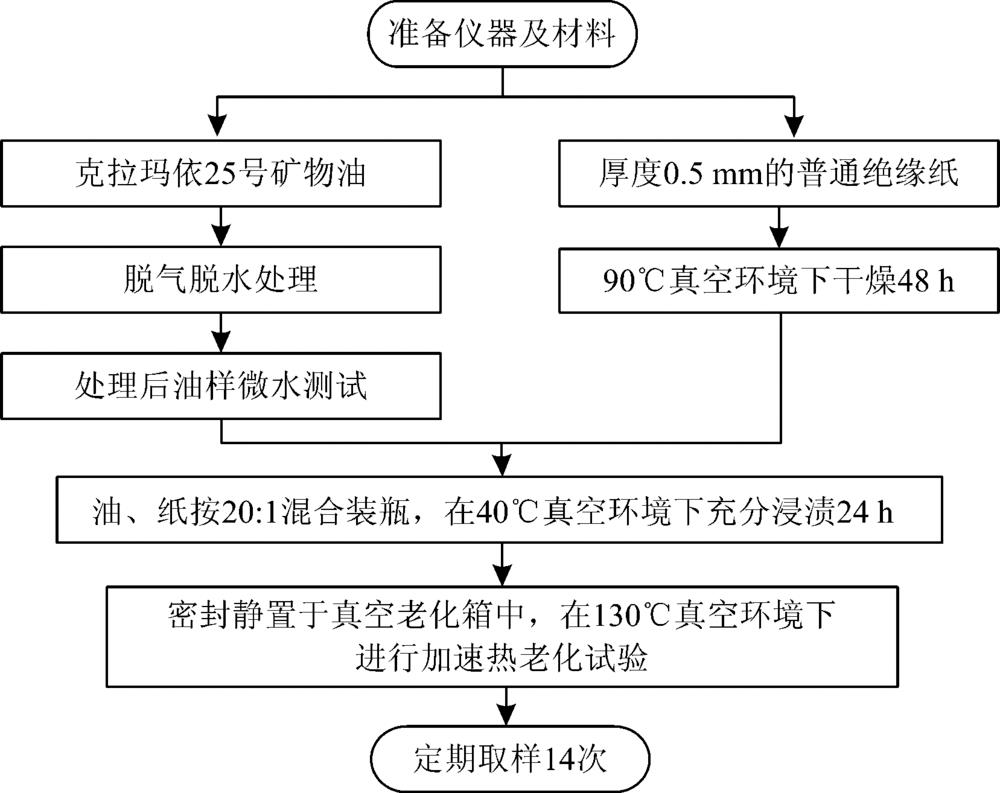
Fig. 1. Preparation flowchart of accelerated thermal aging samples
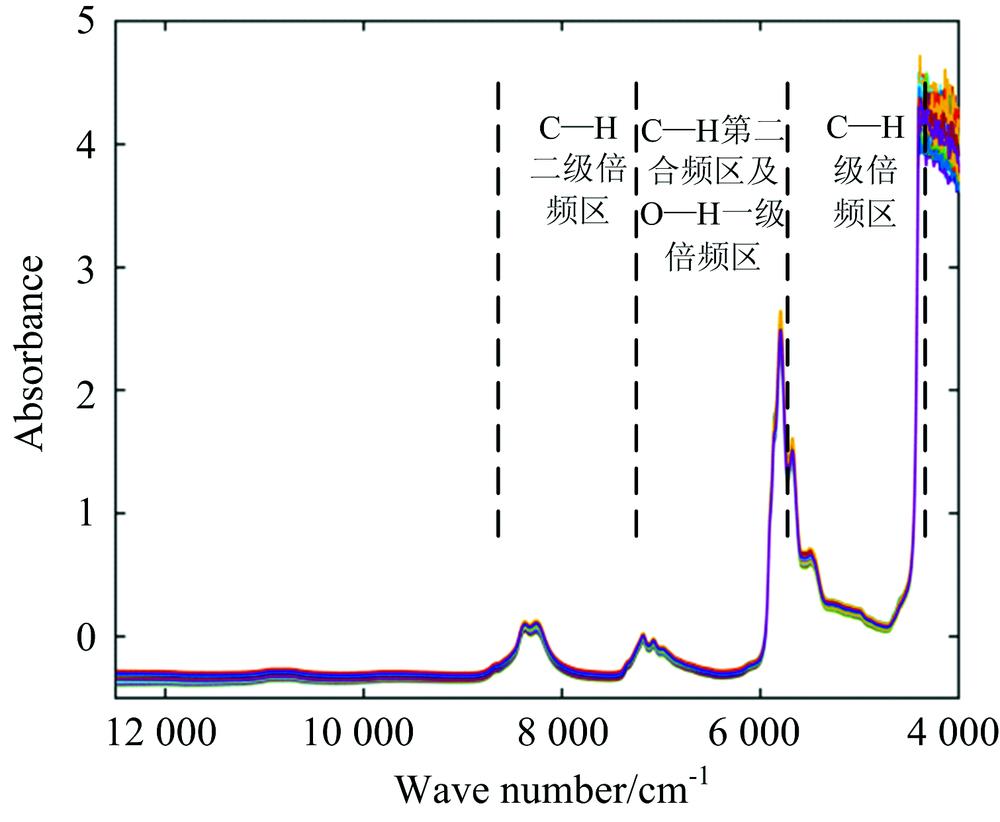
Fig. 2. Original spectra of 140 insulating oil samples
Fig. 3. Correlation between furfural content in oil and aging time
Fig. 4. The iPLS plot of original spectra
Fig. 5. Contribution rates of seven principal components of NIR spectra of insulating oil samples
Fig. 6. Prediction results of four aging time models
Fig. 7. The iPLS plot of original spectra
Fig. 8. Contribution rates of four principal components of NIR spectra of insulating oil samples
Fig. 9. Prediction results of four furfural content models
|
Table 1. Furfural content and aging time of insulating oil samples
|
Table 2. Attribution of absorption near-infrared spectral peaks of insulating oil
| ||||||||||||||||||||||||||||||||||||||||||||||
Table 3. Predicting results of correction model with different BP learning algorithms
| |||||||||||||||||||||||||||||
Table 4. Predicting results of models with different correction methods
| ||||||||||||||||||||||||||||||||||||||||||||||
Table 5. Predicting results of correction models with different BP learning algorithms
| |||||||||||||||||||||||||||||
Table 6. Predicting results of models with different correction methods

Set citation alerts for the article
Please enter your email address
© Copyright 2018-2021 | Chinese Laser Press. All Rights Reserved 沪ICP备15018463号-20