
Liu Pei, Huang Yaping. Semi-Supervized Crack-Detection Method Based on Image-Semantic Segmentation[J]. Laser & Optoelectronics Progress, 2021, 58(6): 615004
- Laser & Optoelectronics Progress
- Vol. 58, Issue 6, 615004 (2021)
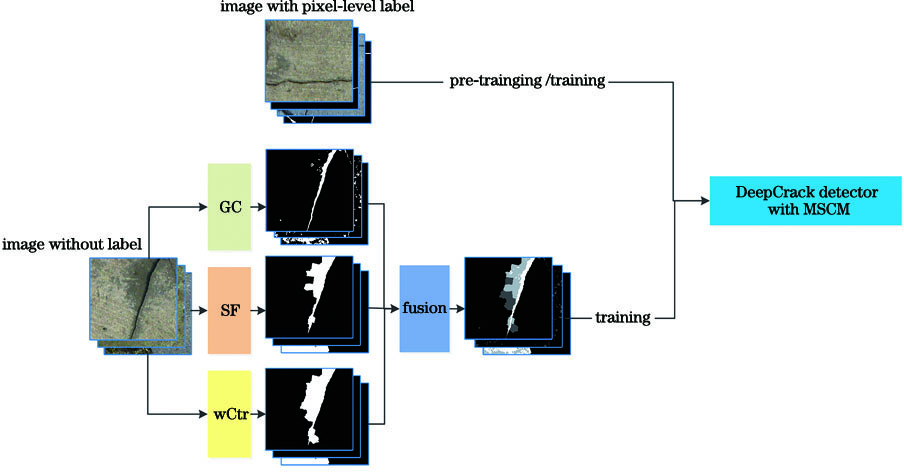
Fig. 1. Semi-supervised training framework
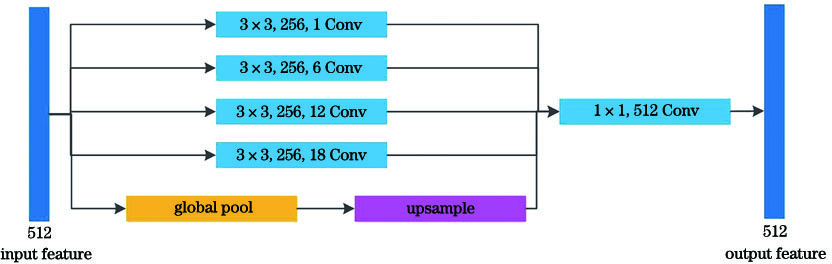
Fig. 2. MSCM structure
Fig. 3. Improved network framework
Fig. 4. Pseudo tags obtained by different methods. (a) Original images; (b) ground-truth; (c) SF method; (d) wCtr method; (e) GC method
Fig. 5. Crack-detection effect under different networks. (a) Original images; (b) ground-truth; (c) SegNet network; (d) DeepCrack network; (e) proposed network
Fig. 6. Cack detection effect after training with different proportion of manual tag and pseudo tag. (a) Original images; (b) ground-truth; (c) 0; (d) 1/150; (e) 1/65; (f) 1/30; (g) 1/15; (h) 1/6; (i) 1
Fig. 7. Detection effect of different cracks in different networks under full supervision. (a) Original images; (b) ground-truth; (c) SegNet network; (d) DeepCrack network; (e) proposed network
|
Table 1. Crack-detection results of different networks
|
Table 2. Quantitative analysis results of three methods
|
Table 3. Quantitative analysis results of manual labeled dataset and pseudo labeled dataset in different proportions
|
Table 4. Quantitative analysis results after pre-training on different proportions of manually annotated datasets
|
Table 5. Crack detection results of SF, wCtr and GC methods under different fusion coefficients
|
Table 6. Crack detection results of different networks under full supervision

Set citation alerts for the article
Please enter your email address
© Copyright 2018-2021 | Chinese Laser Press. All Rights Reserved 沪ICP备15018463号-20