• Chinese Optics Letters
  • Vol. 13, Issue 7, 073001 (2015)
Xiaohu Fu1、2, Kangkang Liu1、2, Ruchen Zhao1、2, Wei Gou1、2, Jianfang Sun1, Zhen Xu1、2、3、*, and Yuzhu Wang1、2、3
Author Affiliations
  • 1Key Laboratory for Quantum Optics, Shanghai Institute of Optics and Fine Mechanics, Chinese Academy of Sciences, Shanghai 201800, China
  • 2University of Chinese Academy of Science, Beijing 100049, China
  • 3Center for Cold Atom Physics, Chinese Academy of Sciences, Shanghai 201800, China
  • show less
    DOI: 10.3788/COL201513.073001 Cite this Article Set citation alerts
    Xiaohu Fu, Kangkang Liu, Ruchen Zhao, Wei Gou, Jianfang Sun, Zhen Xu, Yuzhu Wang. Polarization spectroscopy of the 1S0-3P1 transition of mercury isotopes at 253.7  nm[J]. Chinese Optics Letters, 2015, 13(7): 073001 Copy Citation Text show less
    Schematic of PS. BD, beam dump.
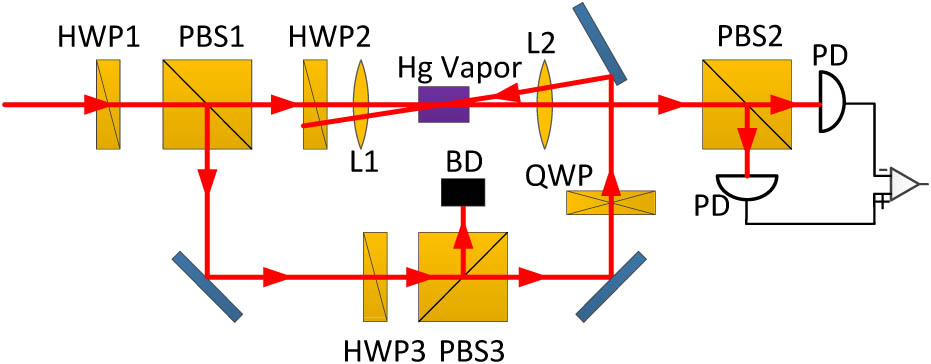
    Fig. 1. Schematic of PS. BD, beam dump.
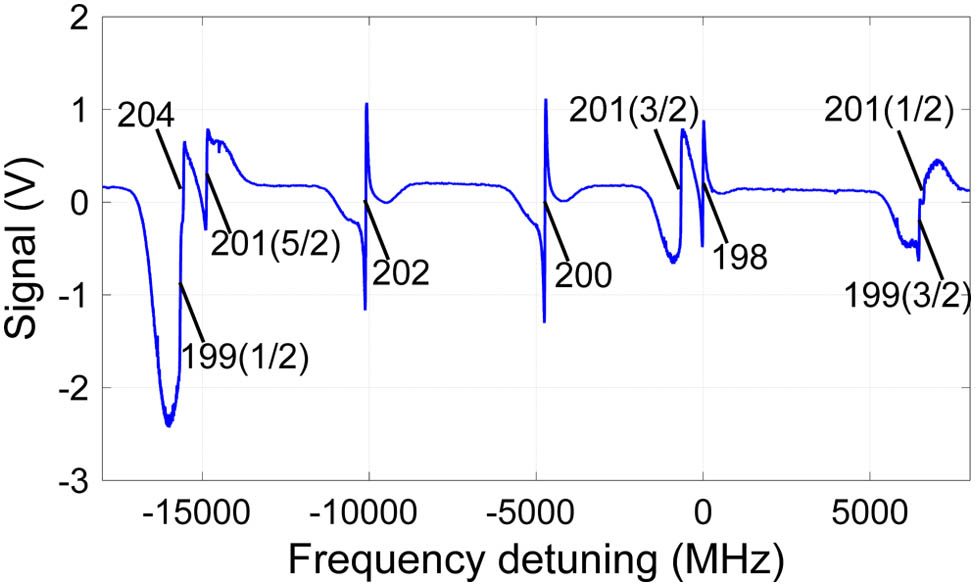
    Overall PS of the S01-P31 transition of Hg isotopes.
    Fig. 2. Overall PS of the S01-P31 transition of Hg isotopes.
    Details of PS of all different transitions: (a), PS of Hg199(1/2), Hg204, and Hg201(5/2); (b) PS of Hg202; (c) PS of Hg200; (d) PS of Hg201(3/2) and Hg198; (e) PS of Hg199(3/2) and Hg201(1/2).
    Fig. 3. Details of PS of all different transitions: (a), PS of Hg199(1/2), Hg204, and Hg201(5/2); (b) PS of Hg202; (c) PS of Hg200; (d) PS of Hg201(3/2) and Hg198; (e) PS of Hg199(3/2) and Hg201(1/2).
    Relation of the amplitude (slope) of the PS of Hg202 and pump power at a probe power of 200 μW. Results are averaged from five measurements.
    Fig. 4. Relation of the amplitude (slope) of the PS of Hg202 and pump power at a probe power of 200 μW. Results are averaged from five measurements.
    Relation of the amplitude (slope) of the PS of Hg202 and probe power at a pump power of 1 mW. Results are averaged from five measurements.
    Fig. 5. Relation of the amplitude (slope) of the PS of Hg202 and probe power at a pump power of 1 mW. Results are averaged from five measurements.
    (a) PS signals of Hg202 with different rotation angles (0°, 15°, 30°, and 45°). Blue dots, actual signal. Red line, fitting result; (b) amplitude of the Lorentzian component in the PS of Hg202 with different angles; (c) amplitude of the dispersion component in the PS of Hg202 with different angles.
    Fig. 6. (a) PS signals of Hg202 with different rotation angles (0°, 15°, 30°, and 45°). Blue dots, actual signal. Red line, fitting result; (b) amplitude of the Lorentzian component in the PS of Hg202 with different angles; (c) amplitude of the dispersion component in the PS of Hg202 with different angles.
    Isotopes (Atomic Mass)Natural Abundance (%)Nuclear Spin I
    1960.150
    19810.10
    19917.01/2
    20023.10
    20113.23/2
    20229.60
    2046.850
    Table 1. Natural Abundance and Nuclear Spin of Hg Isotopesa
    TransitionsFrequency Shift (MHz)
    Hg198, F=1/215,409.0±12.8
    Hg20415,312.5±12.8
    Hg201, F=5/214,658.7±9.9
    Hg20210,101.8±4.5
    Hg2004805.4±4.5
    Hg201, F=3/2676.3±5.7
    Hg1980
    Hg199, F=3/26727.3±6.9
    Hg201, F=1/26872.1±15.3
    Table 2. Frequency Shifts, Relative to Hg198, of S01-P31 Transitions for All Hg Isotopesa
    Xiaohu Fu, Kangkang Liu, Ruchen Zhao, Wei Gou, Jianfang Sun, Zhen Xu, Yuzhu Wang. Polarization spectroscopy of the 1S0-3P1 transition of mercury isotopes at 253.7  nm[J]. Chinese Optics Letters, 2015, 13(7): 073001
    Download Citation