We experimentally observe polarization spectroscopy (PS) of the transition of mercury atom gases at 253.7 nm. The PS signal can be observed in all six richly abundant isotopes and the PS signal of six transitions for laser cooling are all clear and of a dispersive line shape. The optimized pump power and probe power are found for the PS of . We find the linearly polarized component in the pump beam will distort the original PS signal due to the use of linear PS. Consequently, the purity of the pump beam is crucial to laser frequency stabilization by PS.
The Hg atom is attracting much research interest. Hg (atomic number ) is the heaviest nonradioactive atom which can be laser-cooled, so it is sensitive to many “new physics” experiments that are closely related to [1], such as parity-violating amplitudes and atomic charge parity-violating (Time, Parity-odd) permanent electric dipole moments (EDM) which are proportional to [1,2]. Furthermore, the clock transition () of neutral Hg atoms shows the lowest susceptibility to the blackbody radiation field in optical lattice clocks, which has become the major limitation of optical lattice clocks with Yb and Sr atoms[3,4]. To pursue an optical lattice clock based on neutral mercury atoms, the first step is to cool Hg atoms with the transition[1], and it is necessary to stabilize the UV laser on the cooling transition.
In this work, we observe polarization spectroscopy (PS) of the cooling transition () at 253.7 nm. The configuration of PS is quite simple, and it gives a dispersive error signal for laser frequency stabilization[5–7]. Unlike dichroic atomic vapor laser lock spectroscopy, PS requires no strong magnetic field[8–10]. Furthermore, it also does not need modulation and demodulation devices, which are used in frequency modulation spectroscopy and modulation transfer spectroscopy. Because of the cancellation of the Doppler background, it principally gives high-resolution results[8] and has already been widely used in atomic and molecular spectroscopy.
The fundamental configuration of PS consists of a strong circularly polarized pump beam and a weak linearly polarized probe beam[8,11]. It can be regarded as a form of pump-probe spectroscopy, such as saturation spectroscopy[11], but with anisotropic polarized atoms caused by the circularly polarized pump beam. With the right-handed circularly polarized pump beam (), the atom transits from the ground state with ( is the magnetic quantum number) to the excited state with . Saturated by the pump beam, the absorption rate () of the probe beam is smaller than the absorption rate () of the probe beam. According to the Kramers–Kronig dispersion relation[6], the refraction indices and for the and beam are also different. Due to this kind of birefringence, the polarization of the probe beam rotates with a small angle, which is applied to detect the PS signal.
Sign up for Chinese Optics Letters TOC. Get the latest issue of Chinese Optics Letters delivered right to you!Sign up now
The rotation angle of laser polarization is experimentally measured by heterodyne detection. The probe laser, which is linearly polarized at 45° to the horizontal direction, passes through a mercury vapor cell, and the power difference of the horizontal and vertical polarized components is detected. Therefore the differential signal remains at zero without the pump beam. While the vapor cell is pumped with a counter-propagated right-handed circularly polarized beam (), a dispersion signal will be detected according to the following analysis[8,9,11]. We use the Jones matrix method in linear polarization (LP) representation to analyze the probe beam. Because the absorption matrix is diagonal in circular polarization (CP) representation, a unitary transformation matrix from LP representation to CP representation is used as
Assuming that the input beam is in the horizontal direction (), the input electrical field vector can be written as . To rotate the polarization, a half-wave plate (HWP) is inserted before the vapor cell. The output beam can be written as where is the length of the Hg vapor cell, is the angle between the fast axis of HWP and the -axis, and are wave vectors of the and beam in the Hg vapor cell, and and are those in the windows of the cell. is the thickness of the windows. and are the absorption coefficients of the windows. Because the intensity is proportional to , the intensity can be deduced as where and are the detected intensities of the and components, respectively; is the intensity of the input beam. The intensity difference is where , represents the index of refraction, and is the transition wavelength of 253.7 nm. In Eq. (4), the contribution from the windows can be neglected, because its absorption coefficient is rarely less than that of the mercury atoms and the corresponding birefringence of the windows is also not comparable. When is set as , and () is much smaller than 1, the approximation is good.
Normally, the profile of Doppler free spectroscopy is Lorentzian where is the maximum absorption rate at resonance, and is the scaled detuning. Thus the difference in the wave vector is written as per Eq. (6) according to the Kramers–Kronig dispersion relation[6]Therefore PS is a Doppler-free and dispersive signal.
PS is performed on Hg atoms in the transition . Table 1 shows the natural abundance and the nuclear spin of seven stable isotopes of Hg. Six isotopes are richly abundant with more than 6%. Four isotopes (, , , and ) are bosonic with nuclear spin , and two isotopes ( and ) are fermionic with and 3/2, respectively[1,12–14]. In the state, bosonic isotopes have no hyperfine splitting level but has three levels (, 3/2, and 5/2) and has two levels ( and 3/2)[14]. Table 2 shows the frequency shifts of transitions which are relative to [13,14]. The transitions, which have a frequency shift interval that is smaller than the Doppler broadening of about 1 GHz, will share the same absorption profile. Thus (), and () share one, and so do () with , and () with ().
Isotopes (Atomic Mass)
Natural Abundance (%)
Nuclear Spin I
196
0.15
0
198
10.1
0
199
17.0
1/2
200
23.1
0
201
13.2
3/2
202
29.6
0
204
6.85
0
Table 1. Natural Abundance and Nuclear Spin of Hg Isotopesa
Because the Hg atom has a high saturated vapor pressure at room temperature (about 0.3 Pa), a 5 mm long vapor cell (made of UV fused silicon[13], set at room temperature) is adopted to achieve an appropriate optical depth (OD) for saturated absorption for all transitions. A commercial laser (Toptica, TA-FHG Pro), which generates 20 mW laser power at 253.7 nm by frequency quadrupling of a fundamental diode laser at 1014.9 nm with a 30 GHz mode-hop-free range and 150 kHz linewidth, is used in this work. About 3 mW of output laser is split to observe the PS.
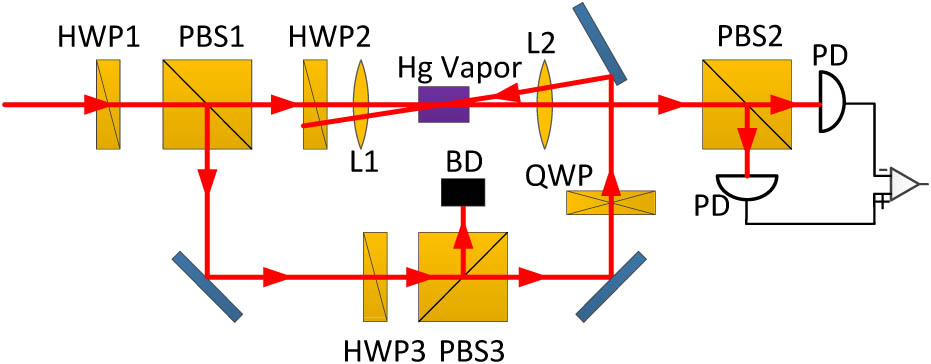
A schematic of PS is shown in Fig. 1. HWP1 and polarization beam splitter 1 (PBS1) are used to initialize the polarization and adjust the power of the probe beam. HWP3 and PBS3 play the same roles for the pump beam. A quarter-wave plate (QWP) is used to transform the pump beam from LP to CP. HWP2 is used to rotate the polarization of the probe beam. PBS2 splits the probe beam into two beams with horizontal and vertical polarization which can be detected by two photodiodes (PDs). The difference of these two signals gives PS. To overcome the problem of a poor laser profile and enhance the overlap of the pump and probe beam, two lenses (L1 and L2) with 120 mm focal length are used to focus two beams onto the vapor cell. The diameter of the pump and probe laser is about 0.5 mm.
We observed the overall PS of Hg isotopes at a pump power of 500 μW and probe power of 200 μW. In Fig. 2, all of the transitions are observed. The Doppler background is strongly reduced, yet not removed completely. The original principle of PS should satisfy the approximation of small and , which leads to . However it is not fully satisfied in our work, because the OD of a 5 mm long vapor cell is larger than 2 for all cooling transitions. The profiles of close transitions are distinctly influenced by the residual Doppler background. Thus they are not a standard dispersive profile like and .
Figure 2.Overall PS of the transition of Hg isotopes.
The details of PS signals are shown in Fig. 3 for all transitions. By heterodyne detection we have deduced the power noise of the laser and improved the SNR of the signal to about 100[15]. The PS amplitude of is smaller than that of , even though has the larger natural abundance and the same level structure. It is because the OD of is 9.04 which is too big for saturation. For the fermionic isotopes with nonzero nuclear spin, the PS is also related to the magnetic sublevels which have an influence on the saturation time and transition intensity[9]. Thus different hyperfine structure transitions of fermionic isotopes have different PS amplitudes. It should be noted that transitions used in laser cooling [, , , , , and ] are all of a dispersive shape and have a sharp slope, because they do not have a dark state under circularly polarized pumping.
Figure 3.Details of PS of all different transitions: (a), PS of , , and ; (b) PS of ; (c) PS of ; (d) PS of and ; (e) PS of and .
To stabilize the laser frequency, the amplitude and slope are both important parameters to judge the quality of the error signal. PS is quite a simple method and without the consideration of atom properties, the pump beam and the probe beam are the main factors that affect it. In our work, we used the peak-to-peak difference as the amplitude of the PS signal, and the slope of the line between these two peaks as the slope of the PS signal. Thus the slope is equal to the amplitude divided by the width of the PS; namely, the frequency interval between these two peaks. These parameters were optimized for as follows.
First, we investigated the influence of the pump power at a fixed probe power of 200 μW. The relation of the PS signal and pump power is plotted in Figs. 4(a) and 4(b). The amplitude and slope grow steeply with smaller pump power below 0.5 mW. The gain of excited atoms with the enhancement of pump power leads to this phenomenon[6,8]. Then increasing speed of the amplitude slows down for the saturation effect (saturation intensity is about [1,13]). Meanwhile, the width of the PS increases, and thus the slope of PS decreases above 1 mW as per Fig. 4(b)[6,8,16,17].
Figure 4.Relation of the amplitude (slope) of the PS of and pump power at a probe power of 200 μW. Results are averaged from five measurements.
Second, the influence of the probe power was investigated at a pump power of 1 mW. The amplitude and slope increase with the probe power as shown in Figs. 5(a) and 5(b). With small probe power, the amplitude and slope increases almost linearly. When the probe power is comparable with the pump power, the principle of PS has to be modified as follows. When the population of the excited state with reduces with increasing probe power, the enhancement of the PS signal declines. At a probe power of above 0.7 mW, the amplitude tends to be flat while the slope decreases.
Figure 5.Relation of the amplitude (slope) of the PS of and probe power at a pump power of 1 mW. Results are averaged from five measurements.
Besides the power of the pump beam and probe beam, the polarization purity of the pump beam will also affect the PS signal. Actually the pump beam cannot be purely right-handed circularly polarized but elliptical, while the imperfection of the QWP (CVI laser optics, QWPO-257-05-4) and birefringence of the cell window are taken into consideration[18]. That means the pump beam is composed of a large circularly polarized component and a small linearly polarized component. This influences the actual signal profile to some extent. The linearly polarized component of the pump beam would result in linear PS. Linear PS was first observed by Murray Sargent III in 1976; i.e., that for identical polarizations, both probe and saturating waves involve the same combinations of transitions and matrix elements, while for orthogonal polarizations they involve different combinations[11,13,19,20]. Thus the absorption rate of the probe beam with identical polarization () differs from that with perpendicular polarization (). Additionally, there would be a Lorentzian item contained in the actual PS signal. To confirm this effect, we measured the PS signal with different rotation angles of the QWP, and fit this signal with a combination of the Lorentzian component and dispersive component as shown in Fig. 6(a). The actual and fitting results match each other very well with an R-squared value of more than 99.5%. In our previous work, the rotation angle (between the fast axis of the QWP and the -axis) is set as 45°, so that is a typical dispersive profile. As the angle is far from 45°, the linearly polarized component increases and the signal becomes Lorentzian. We pick up the amplitude of the dispersive and Lorentzian components, respectively, as shown in Fig. 6(b) and 6(c). As the angle approaches 45°, the amplitude of the Lorentzian component decreases to zero and the amplitude of the dispersive part increases. This agrees with the theoretical analysis well.
Figure 6.(a) PS signals of with different rotation angles (0°, 15°, 30°, and 45°). Blue dots, actual signal. Red line, fitting result; (b) amplitude of the Lorentzian component in the PS of with different angles; (c) amplitude of the dispersion component in the PS of with different angles.
Because the standard PS signal is odd-symmetrical but the Lorentzian signal is even-symmetrical, the participation of the linear polarized component will distort the original PS signal. The imperfect purity of the pump beam will induce zero crossing shift and an unbalanced amplitude of the PS signal. Furthermore, because of the Lorentzian component in PS, the zero crossing point is sensitive to the laser power variation, which will induce a shift in laser frequency stabilization[21]. According to the previous discussion, the polarization purity of the pump beam is a very important factor for PS.
In conclusion, we experimentally observe and study PS of the transition in a mercury vapor cell. The PS signal can be observed in all six richly abundant isotopes and the PS signal of the transitions for laser cooling are all clear and of a dispersive shape. The influence of the pump power and probe power on PS is studied, and the optimized pump and probe power are 1 and 0.7 mW, respectively, for . We find the linearly polarized component in the pump beam will distort the original PS signal due to the LP spectroscopy. To use PS in the context of laser frequency stabilization, it is crucial to purify the CP of the pump beam.