• Photonics Research
  • Vol. 7, Issue 11, 1323 (2019)
Honglin Liu1、3、*, Zhentao Liu1, Meijun Chen1, Shensheng Han1, and Lihong V. Wang2、4、*
Author Affiliations
  • 1Key Laboratory for Quantum Optics, Shanghai Institute of Optics and Fine Mechanics, Chinese Academy of Sciences, Shanghai 201800, China
  • 2Caltech Optical Imaging Laboratory, Andrew and Peggy Cherng Department of Medical Engineering, Department of Electrical Engineering, California Institute of Technology, Pasadena, California 91125, USA
  • 3e-mail: hlliu4@hotmail.com
  • 4e-mail: LVW@caltech.edu
  • show less
    DOI: 10.1364/PRJ.7.001323 Cite this Article Set citation alerts
    Honglin Liu, Zhentao Liu, Meijun Chen, Shensheng Han, Lihong V. Wang. Physical picture of the optical memory effect[J]. Photonics Research, 2019, 7(11): 1323 Copy Citation Text show less
    Comparison of laser light incident upon an aperture (System 1) and a random phase mask (System 2) with no thickness. (a) Tilting the laser beam an angle θ (a shift of dθ along the y axis correspondingly) results in the same amount of tilt (a shift dθ on the observation plane) in the output, as in a typical shift-invariant phenomenon. (b) Tilting the laser beam leads to a corresponding shift in the entire speckle pattern. The red and yellow arrows call attention to similar characteristics and their shifts.
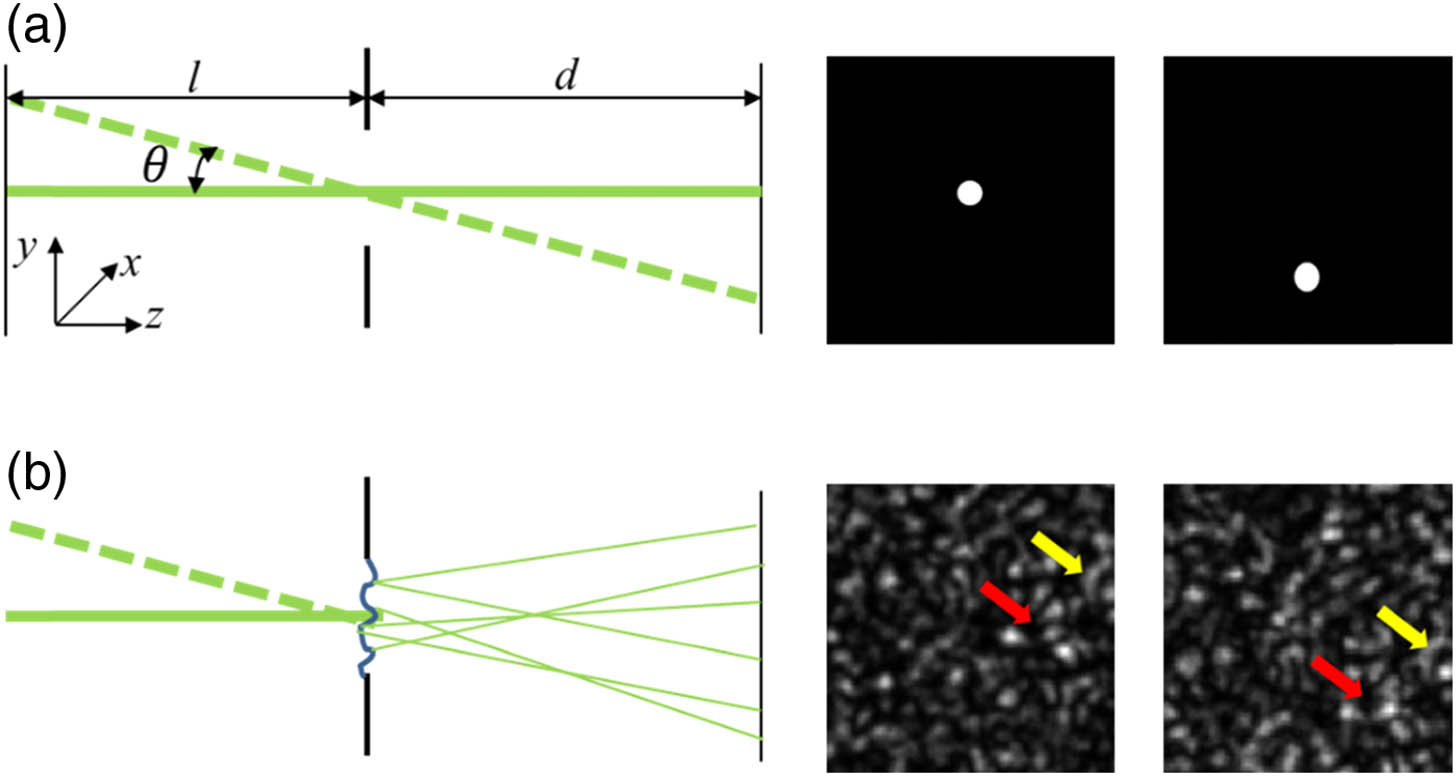
    Fig. 1. Comparison of laser light incident upon an aperture (System 1) and a random phase mask (System 2) with no thickness. (a) Tilting the laser beam an angle θ (a shift of dθ along the y axis correspondingly) results in the same amount of tilt (a shift dθ on the observation plane) in the output, as in a typical shift-invariant phenomenon. (b) Tilting the laser beam leads to a corresponding shift in the entire speckle pattern. The red and yellow arrows call attention to similar characteristics and their shifts.
    Comparison of light propagating through two screens in sequence. The second screen is (a) an aperture, referred to as System 3, and (b) a random phase mask, referred to as System 4.
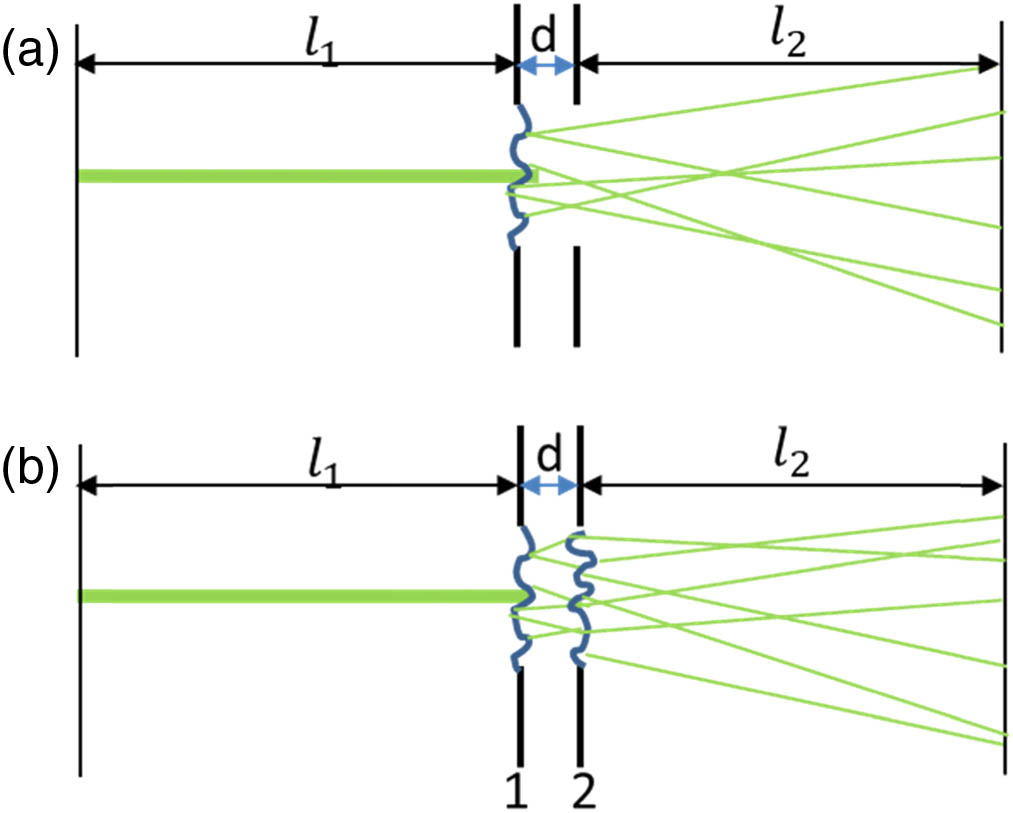
    Fig. 2. Comparison of light propagating through two screens in sequence. The second screen is (a) an aperture, referred to as System 3, and (b) a random phase mask, referred to as System 4.
    Simulation and experimental results. (a) Comparison of the normalized angular PSDs obtained from the MC simulation and Eq. (17) with different anisotropy factors g. As g decreases, the PSD broadens. Both curves peak at θ=0. The value of P(θ) is slightly smaller than that obtained from the MC simulation at larger angles, which might be due to the truncation at m=6 when calculating P(θ). (b) AME curves obtained from the experiment (magenta curve, square markers), simulations with the conventional model (green solid curve), and our new model (black solid curve). (c) A comparison of AME curves with different scattering components including only singly scattered light (green solid curve), i.e., the conventional model, all scattering components integrated (black solid curve), i.e., the sPSD is obtained from the standard MC simulation, ballistic and the first six scattering components (magenta solid curve), and ballistic and only singly scattered light (blue solid curve).
    Fig. 3. Simulation and experimental results. (a) Comparison of the normalized angular PSDs obtained from the MC simulation and Eq. (17) with different anisotropy factors g. As g decreases, the PSD broadens. Both curves peak at θ=0. The value of P(θ) is slightly smaller than that obtained from the MC simulation at larger angles, which might be due to the truncation at m=6 when calculating P(θ). (b) AME curves obtained from the experiment (magenta curve, square markers), simulations with the conventional model (green solid curve), and our new model (black solid curve). (c) A comparison of AME curves with different scattering components including only singly scattered light (green solid curve), i.e., the conventional model, all scattering components integrated (black solid curve), i.e., the sPSD is obtained from the standard MC simulation, ballistic and the first six scattering components (magenta solid curve), and ballistic and only singly scattered light (blue solid curve).
    Workflow for generating the real-domain phase-only masks using the G-S algorithm. M1(fx,fy) and M2(fx,fy) are the Fourier-domain expressions of the mask. M1(x,y) and M2(x,y) are the real-domain expressions of the mask. The algorithm starts from M1(fx,fy) with an initial value of I0 exp(iϑ0), where I0 is the envelope of its amplitude and ϑ0 is a random phase distribution. After several iterations, the algorithm will converge; then, M2(x,y) is the desired phase-only mask.
    Fig. 4. Workflow for generating the real-domain phase-only masks using the G-S algorithm. M1(fx,fy) and M2(fx,fy) are the Fourier-domain expressions of the mask. M1(x,y) and M2(x,y) are the real-domain expressions of the mask. The algorithm starts from M1(fx,fy) with an initial value of I0exp(iϑ0), where I0 is the envelope of its amplitude and ϑ0 is a random phase distribution. After several iterations, the algorithm will converge; then, M2(x,y) is the desired phase-only mask.
    Comparison between the conventional phase mask model and our new phase mask model for a scattering medium with g=0.95. (a) Phase map of the conventional mask. (b) and (c) Phase maps of our new masks when the interval d is set to be the MFP and 0.5 times the MFP, respectively. (d) Phase distributions of the three masks. Compared to the conventional mask in (a), which has a full 2π phase modulation depth, the new masks in (b) and (c) have shallower modulation depths, which allow more ballistic light to pass through. When the interval between adjacent masks is smaller, the modulation depth will be shallower. (e) Spatial frequency distributions of the three masks. The conventional mask has a very smooth spatial frequency distribution, but for the new masks, there is a sharp peak at zero frequency, which is caused by the delta function of the ballistic light. (f) and (g) Memory effect curves for 0.5 mm and 1 mm thick scattering media with an MFP of 0.1 mm and g=0.95 modelled by the conventional phase mask model (purple curve) and our new model (blue curve for d=MFP, orange curve for d=0.5×MFP).
    Fig. 5. Comparison between the conventional phase mask model and our new phase mask model for a scattering medium with g=0.95. (a) Phase map of the conventional mask. (b) and (c) Phase maps of our new masks when the interval d is set to be the MFP and 0.5 times the MFP, respectively. (d) Phase distributions of the three masks. Compared to the conventional mask in (a), which has a full 2π phase modulation depth, the new masks in (b) and (c) have shallower modulation depths, which allow more ballistic light to pass through. When the interval between adjacent masks is smaller, the modulation depth will be shallower. (e) Spatial frequency distributions of the three masks. The conventional mask has a very smooth spatial frequency distribution, but for the new masks, there is a sharp peak at zero frequency, which is caused by the delta function of the ballistic light. (f) and (g) Memory effect curves for 0.5 mm and 1 mm thick scattering media with an MFP of 0.1 mm and g=0.95 modelled by the conventional phase mask model (purple curve) and our new model (blue curve for d=MFP, orange curve for d=0.5×MFP).
    Principle of scanning a time-reversed focus. (a) A point source is placed in front of a scattering medium, and a wavefront of the transmitted light through the medium is recorded by the digital optical phase conjugation (DOPC) system. (b) The point source is removed, and a phase-conjugated wavefront is generated by the DOPC system to create a time-reversed focus at the original position of the point source. By adding a phase ramp to the phase-conjugated wavefront, we can scan the focus along a desired direction.
    Fig. 6. Principle of scanning a time-reversed focus. (a) A point source is placed in front of a scattering medium, and a wavefront of the transmitted light through the medium is recorded by the digital optical phase conjugation (DOPC) system. (b) The point source is removed, and a phase-conjugated wavefront is generated by the DOPC system to create a time-reversed focus at the original position of the point source. By adding a phase ramp to the phase-conjugated wavefront, we can scan the focus along a desired direction.
    Honglin Liu, Zhentao Liu, Meijun Chen, Shensheng Han, Lihong V. Wang. Physical picture of the optical memory effect[J]. Photonics Research, 2019, 7(11): 1323
    Download Citation