Author Affiliations
1Bionic Vision System Laboratory, Shanghai Institute of Microsystem and Information Technology, Chinese Academy of Sciences, Shanghai 200050, China2University of Chinese Academy of Sciences, Beijing, 100049, China3Key Laboratory of Computational Neuroscience and Brain Inspired Intelligence, Ministry of Education, Institute of Science and Technology for Brain-Inspired Intelligence, Fudan University, Shanghai 200433, Chinashow less
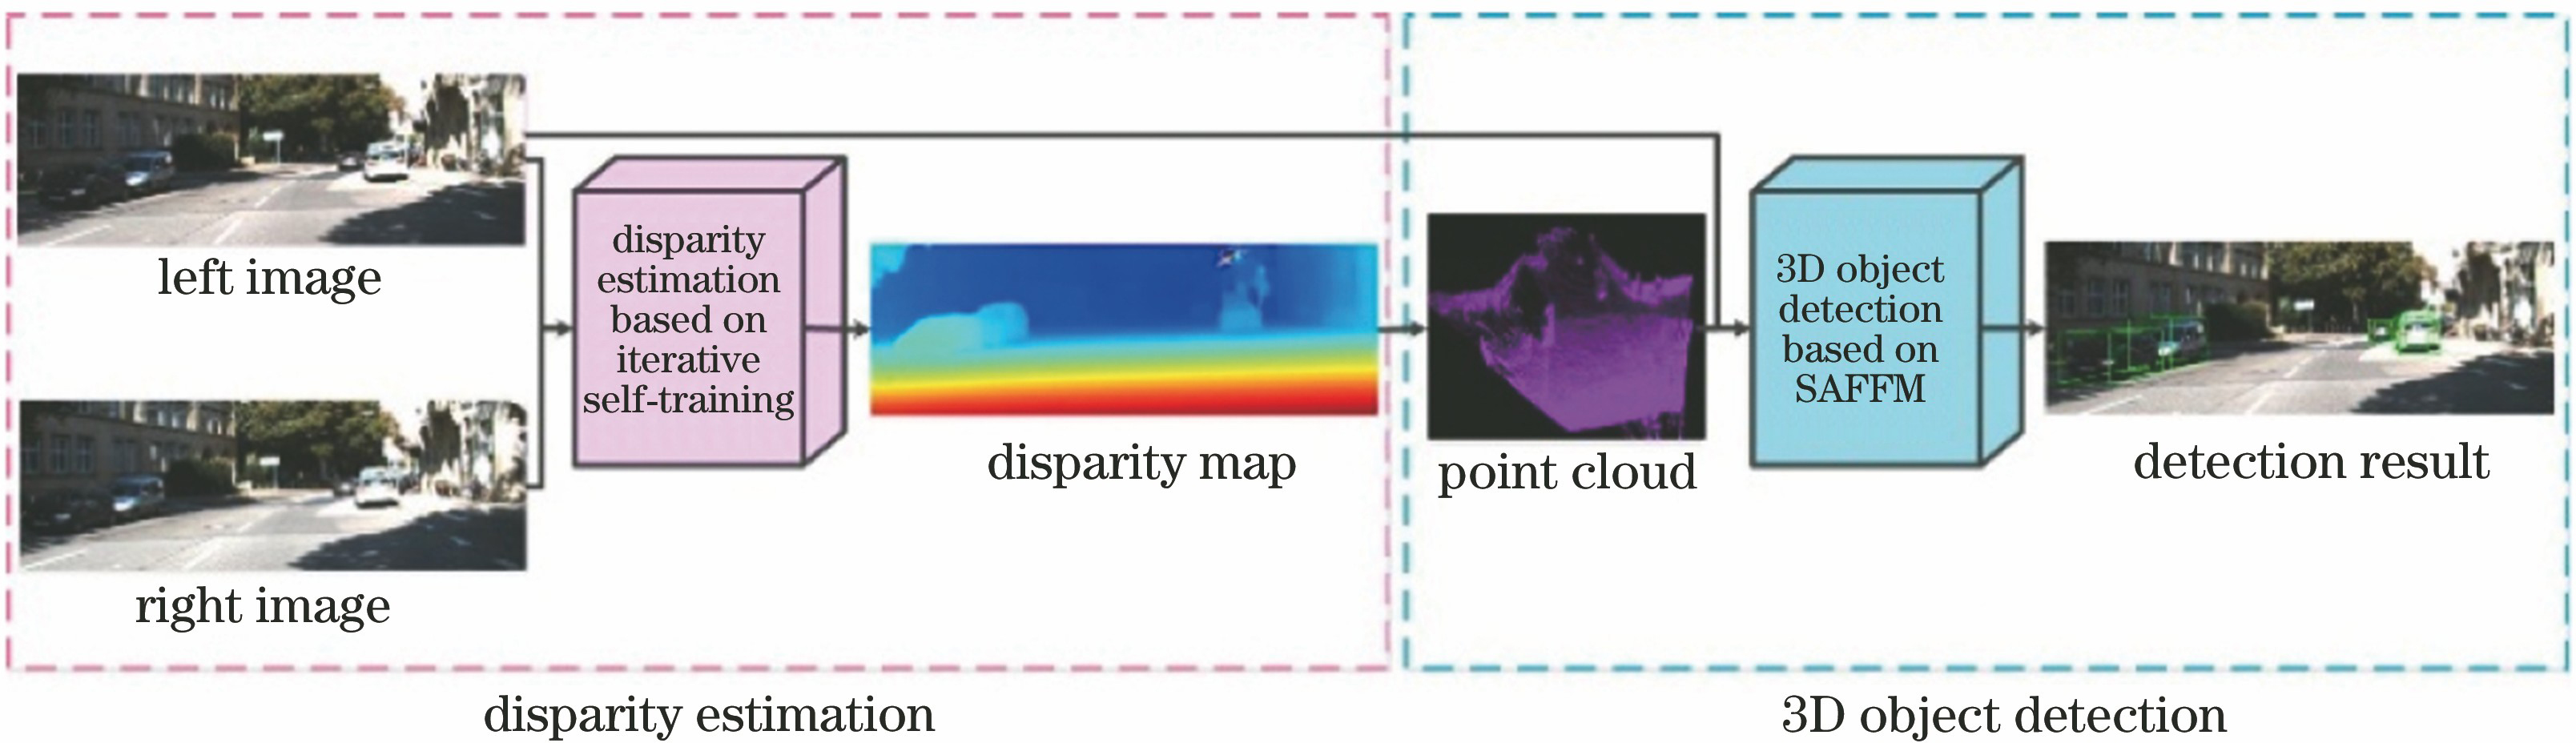
Fig. 1. Flow chart of 3D object detection system
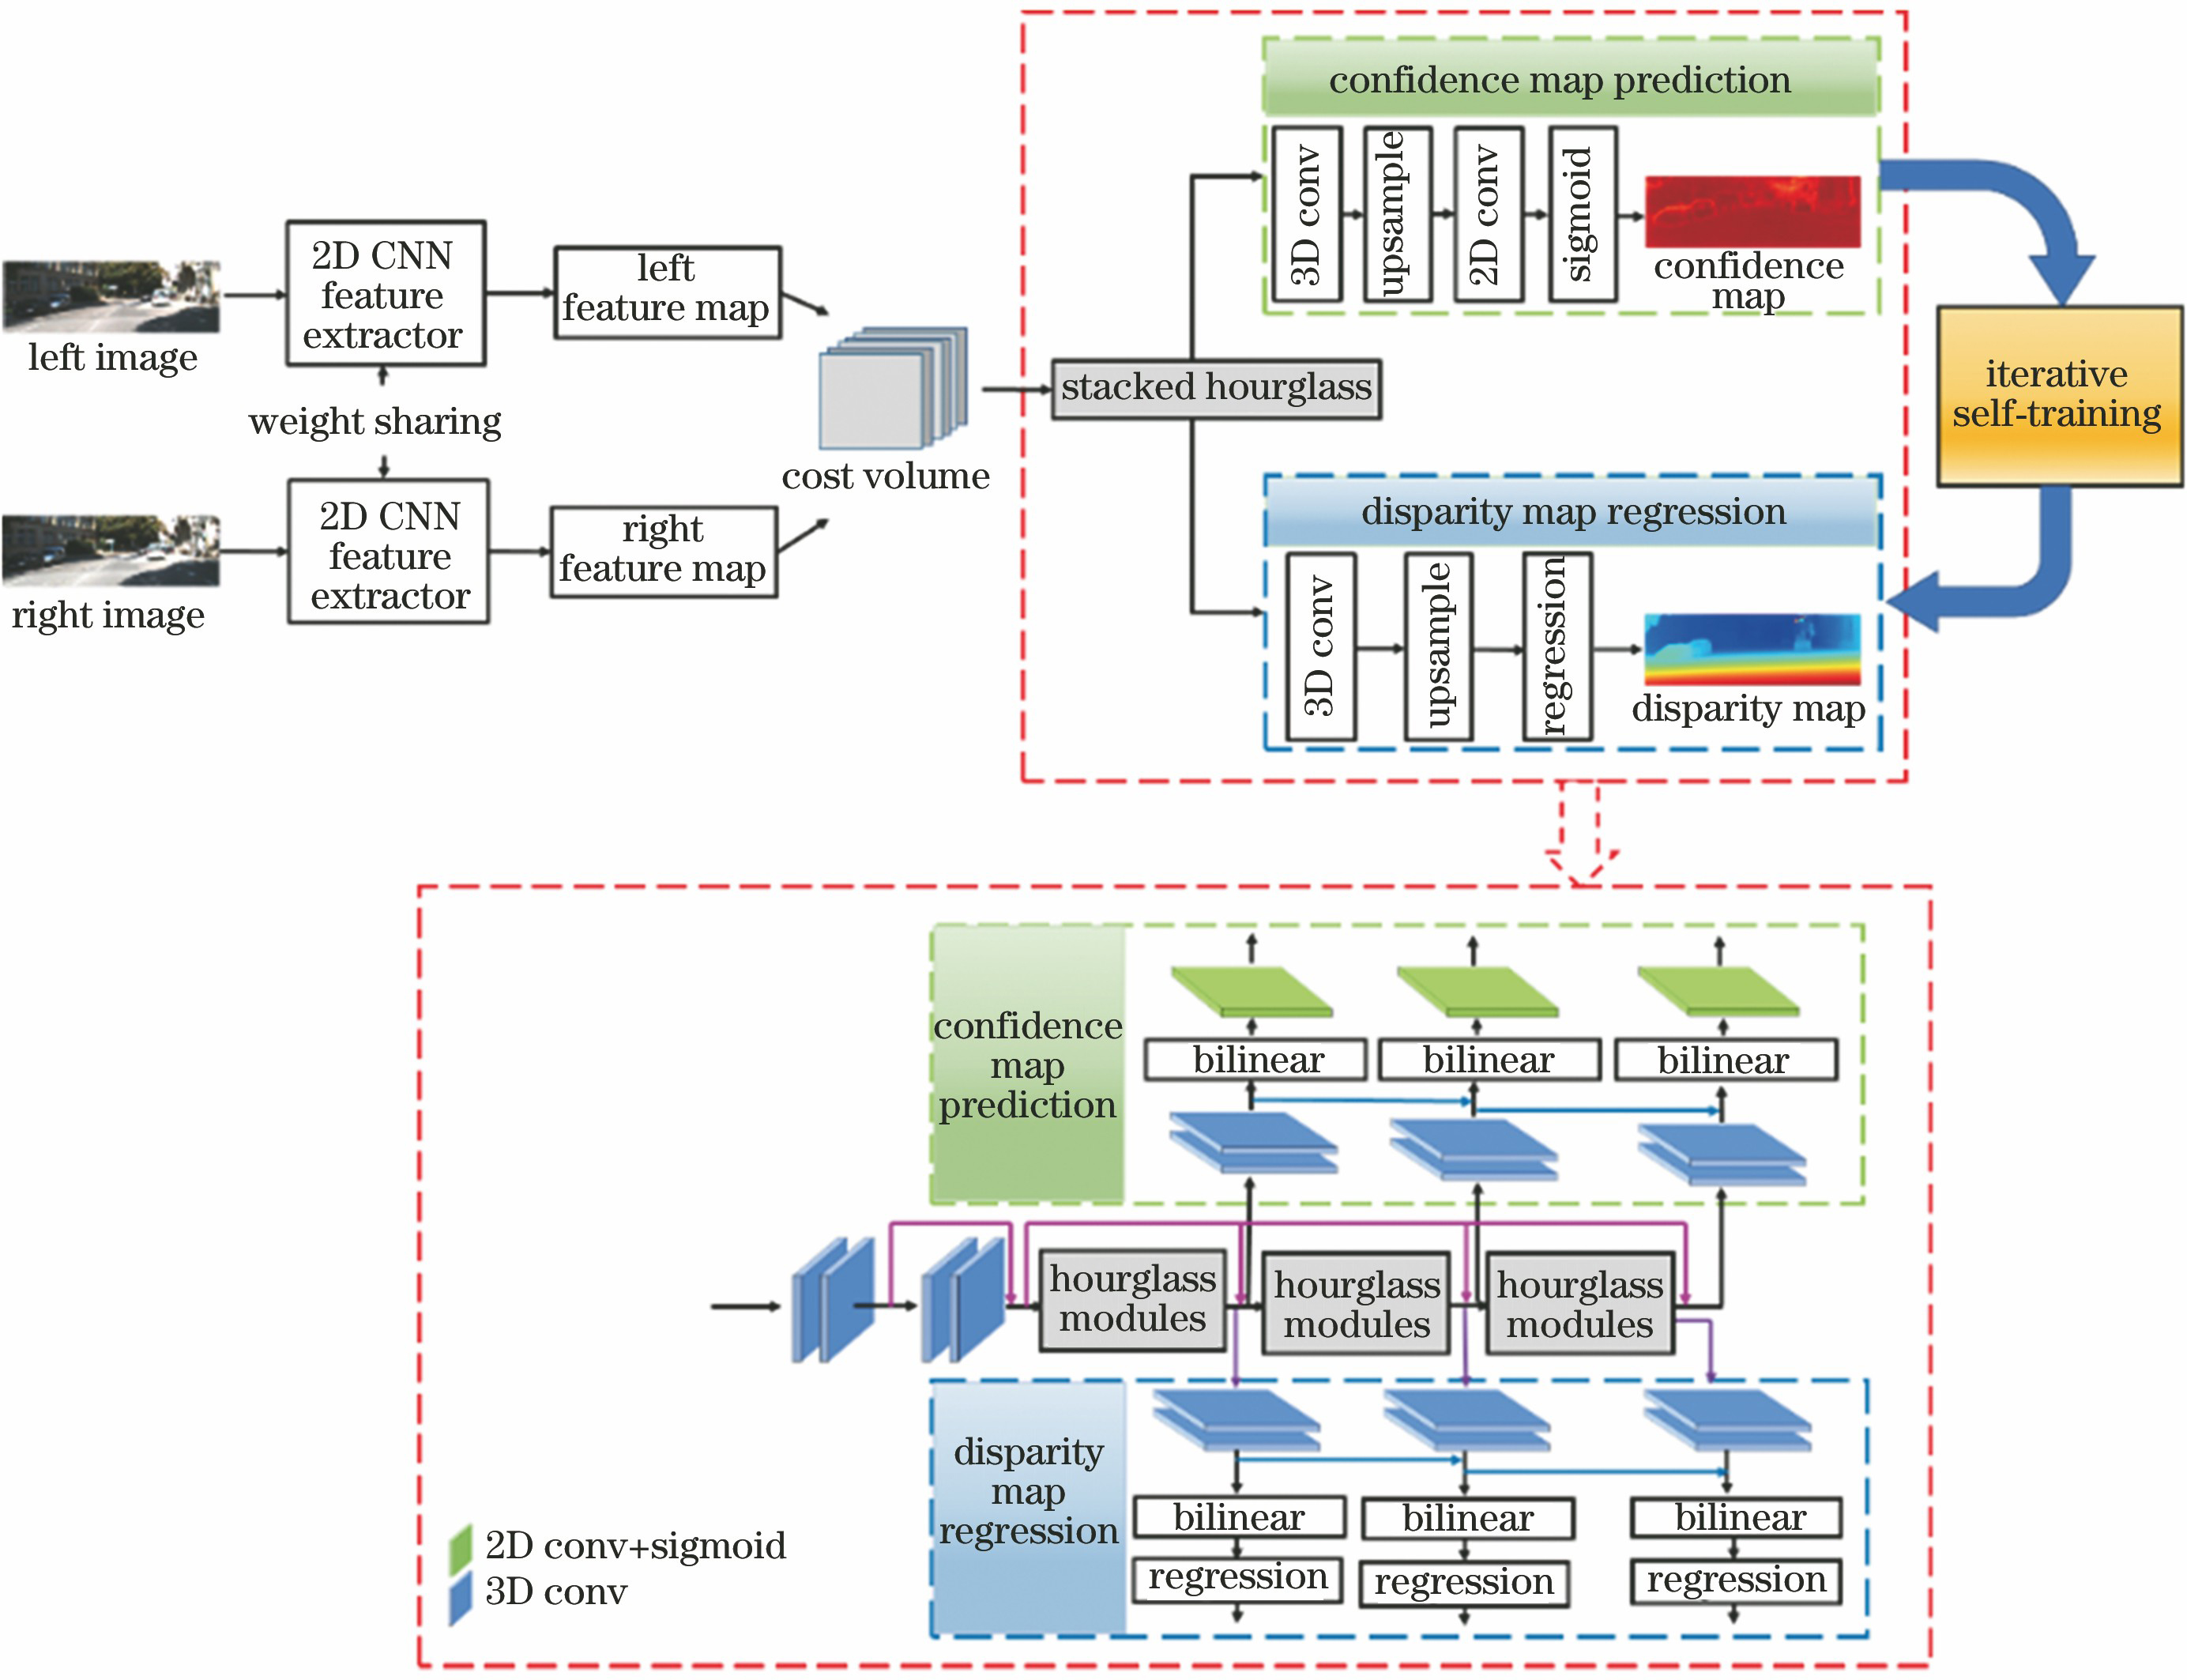
Fig. 2. Architectural diagram of IST-Net
Fig. 3. Flow chart of iterative self-training
Fig. 4. Architectural diagram of SAFF-3DOD Net
Fig. 5. Diagram of SAFFM
Fig. 6. Qualitative comparison of baseline and our method on estimated disparity map. (a) RGB left image; (b) PSMNET method; (c) our disparity estimation method
Fig. 7. Qualitative comparison of baseline and our method on estimated point cloud. (a) RGB left image; (b) PSMNET method; (c) our disparity estimation method
Fig. 8. Qualitative comparison of 3D object detection results. (a) Pseudo- LiDAR; (b) our method
| Parameter | SAFFM in region proposal network | SAFFM in detection network |
|---|
| Layer setting | Output dimension | Layer setting | Output dimension |
|---|
| FRGB/FBEV | | 3×3×1 | | 7×7×32 | | L0 | | | 1--1×1 | 7×7×1 | | IRGB/IBEV | | 9×1×1 | | 49×1×1 | | L1 | 36--1×1 | 36×1×1 | 98--1×1 | 98×1×1 | | L2 | 36--1×1 | 36×1×1 | 98--1×1 | 98×1×1 | | L3 | 18--1×1 | 18×1×1 | 49--1×1 | 49×1×1 | | L4 | 9--1×1 | 9×1×1 | 49--1×1 | 49×1×1 | | Sigmoid | | 9×1×1 | | 49×1×1 | | Spatial-attention map | | 3×3×1 | | 7×7×1 | | Weighted FRGB and weighted FBEV | | 3×3×1 | | 7×7×32 | | Foutput | | 3×3×1 | | 7×7×32 |
|
Table 1. Detailed configuration of SAFFM
| Method | Disparity error rate /% |
|---|
| Object region | Background region | Global image |
|---|
| PSMNET(base) | 8.96 | 4.35 | 5.49 | | Ours(IST) | 8.69 | 4.18 | 5.27 | | Ours(SOL) | 8.72 | 4.20 | 5.30 | | Ours(IST+SOL) | 8.60 | 4.17 | 5.25 |
|
Table 2. Quantitative comparison of disparity estimation on KITTI 3D object detection validation set
| Method | Disparity error rate /% |
|---|
| Object region | Background region | Global image |
|---|
| Stereonet | 11.14 | 5.23 | 6.99 | | PSMNET | 7.23 | 3.33 | 4.44 | | Ours(IST+SOL) | 6.83 | 3.20 | 4.27 |
|
Table 3. Quantitative comparison of disparity estimation on KITTI stereo matching validation set
| Method | IoU is 0.5 | IoU is 0.7 |
|---|
| Easy | Moderate | Hard | Easy | Moderate | Hard |
|---|
| Pseudo-LiDAR(base) | 92.1/91.6 | 78.3/75.3 | 66.7/63.8 | 75.6/61.5 | 55.6/43.3 | 48.3/36.8 | | Ours(IST) | 92.1/91.0 | 80.4/77.4 | 70.8/67.8 | 77.5/61.3 | 59.5/43.3 | 50.6/36.9 | | Ours(SOL) | 92.3/91.5 | 80.6/75.9 | 69.1/66.2 | 78.8/63.1 | 58.2/43.7 | 50.1/37.4 | | Ours(IST+SOL) | 92.1/91.4 | 81.0/78.0 | 69.2/66.3 | 78.4/63.5 | 59.6/45.0 | 50.8/38.6 | | Ours(SAFF) | 92.0/91.5 | 78.3/75.4 | 68.5/65.5 | 77.7/63.0 | 57.1/43.3 | 48.6/37.0 | | Ours | 94.5/92.5 | 81.6/78.6 | 73.6/70.7 | 80.9/65.8 | 60.7/46.1 | 52.3/39.4 |
|
Table 4. Quantitative comparison of 3D object detection on KITTI 3D object detection validation set (units of ABEV and A3D are both %)
| Method | Input | Easy | Moderate | Hard |
|---|
| MonoPSR[7] | Monocular | 18.33/10.76 | 12.58/7.25 | 9.91/5.85 | | Mono3D_PLiDAR[8] | Monocular | 21.27/10.76 | 13.92/7.50 | 11.25/6.10 | | TopNet-HighRes[2] | Lidar | 67.84/12.67 | 53.05/9.28 | 46.99/7.95 | | M3D-RPN[9] | Monocular | 21.02/14.76 | 13.67/9.71 | 10.23/7.42 | | AM3D[10] | Monocular | 25.03/16.50 | 17.32/10.47 | 14.91/9.52 | | RT3D[3] | Lidar | 56.44/23.74 | 44.00/19.14 | 42.34/18.86 | | RT3DStereo[13] | Stereo | 58.81/29.90 | 46.82/23.28 | 38.38/18.96 | | Stereo R-CNN[27] | Stereo | 61.92/47.58 | 41.31/30.23 | 33.42/23.72 | | Pseudo-LiDAR[12] | Stereo | 67.30/54.53 | 45.00/34.05 | 38.40/28.25 | | Ours | Stereo | 71.47/58.70 | 49.61/37.92 | 42.71/31.99 |
|
Table 5. 3D object detection results on KITTI test benchmark(units of ABEV and A3D are both %)