• Acta Optica Sinica
  • Vol. 40, Issue 15, 1512002 (2020)
Yipeng Xiao1, Chaoxia Shi1、*, and Feipeng Da2、3、**
Author Affiliations
  • 1School of Computer Science and Engineering, Nanjing University of Technology, Nanjing, Jiangsu 210094, China
  • 2School of Automation, Southeast University, Nanjing, Jiangsu 210096, China
  • 3Key Laboratory of Measurement and Control of Complex Systems of Engineering, Ministry of Education, Nanjing, Jiangsu 211096, China
  • show less
    DOI: 10.3788/AOS202040.1512002 Cite this Article Set citation alerts
    Yipeng Xiao, Chaoxia Shi, Feipeng Da. Periodic Light Disturbance in Fringe Projection Profilometry[J]. Acta Optica Sinica, 2020, 40(15): 1512002 Copy Citation Text show less
    Schematic of three-dimensional measurement system and grating fringe patterns. (a) Three-dimensional measurement system of structured light; (b) binary grating fringe pattern; (c) binary grating fringe pattern after defocusing
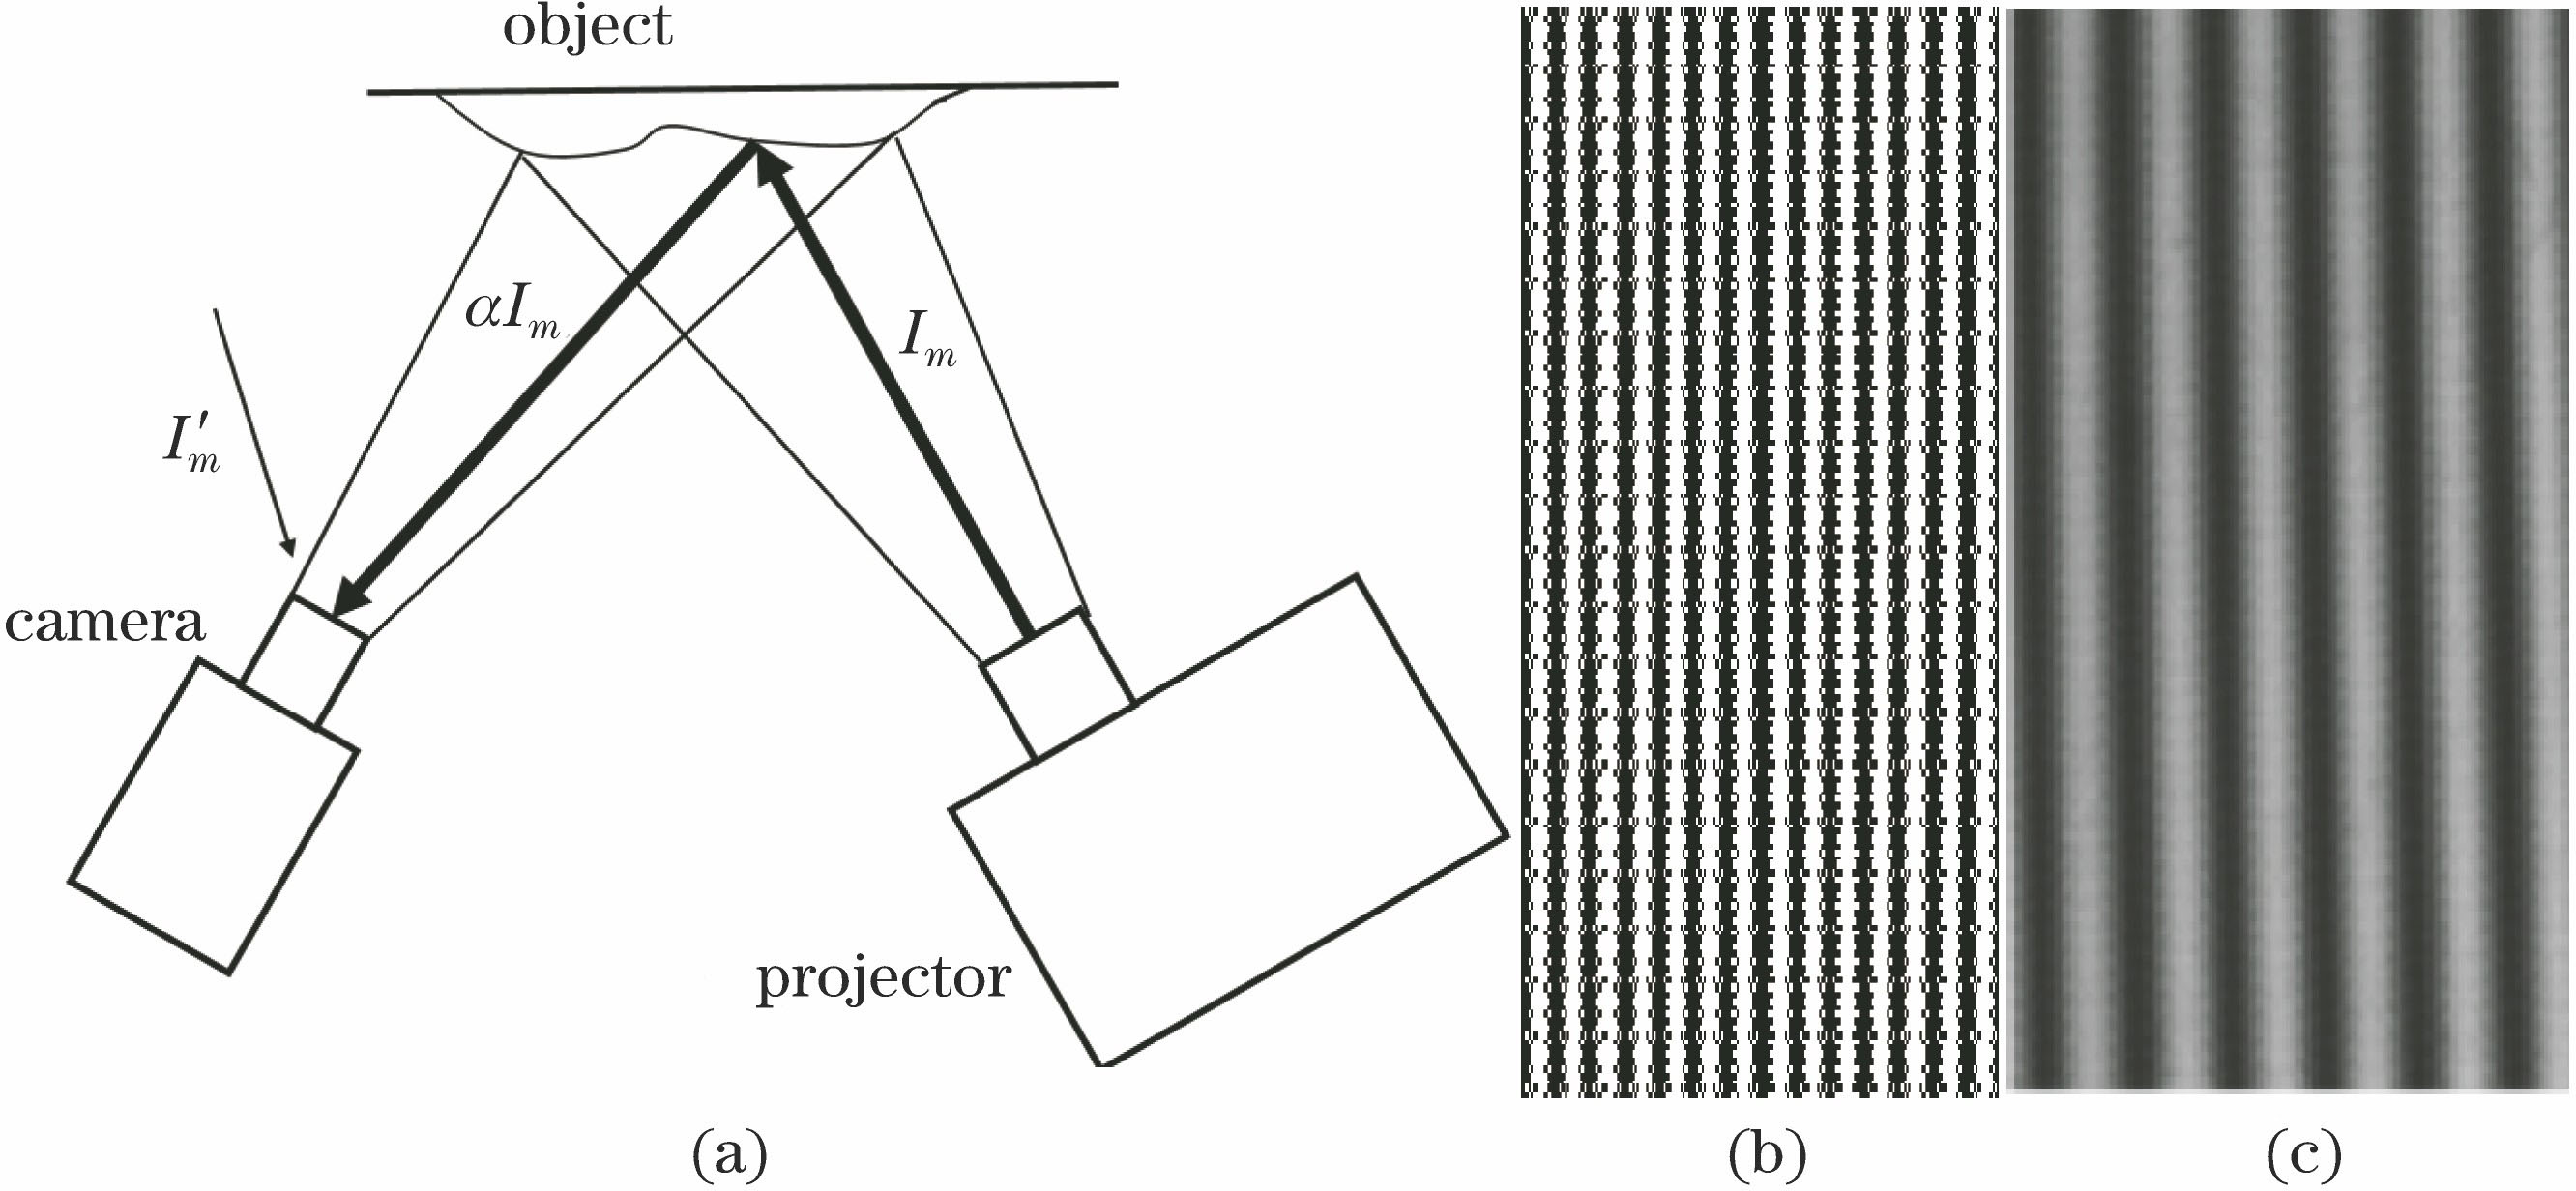
    Fig. 1. Schematic of three-dimensional measurement system and grating fringe patterns. (a) Three-dimensional measurement system of structured light; (b) binary grating fringe pattern; (c) binary grating fringe pattern after defocusing
    Plaster pictures collected by camera. (a) 1st picture collected; (b) picture collected 2 ms later; (c) effect of magnifying gray difference of picture by 10×
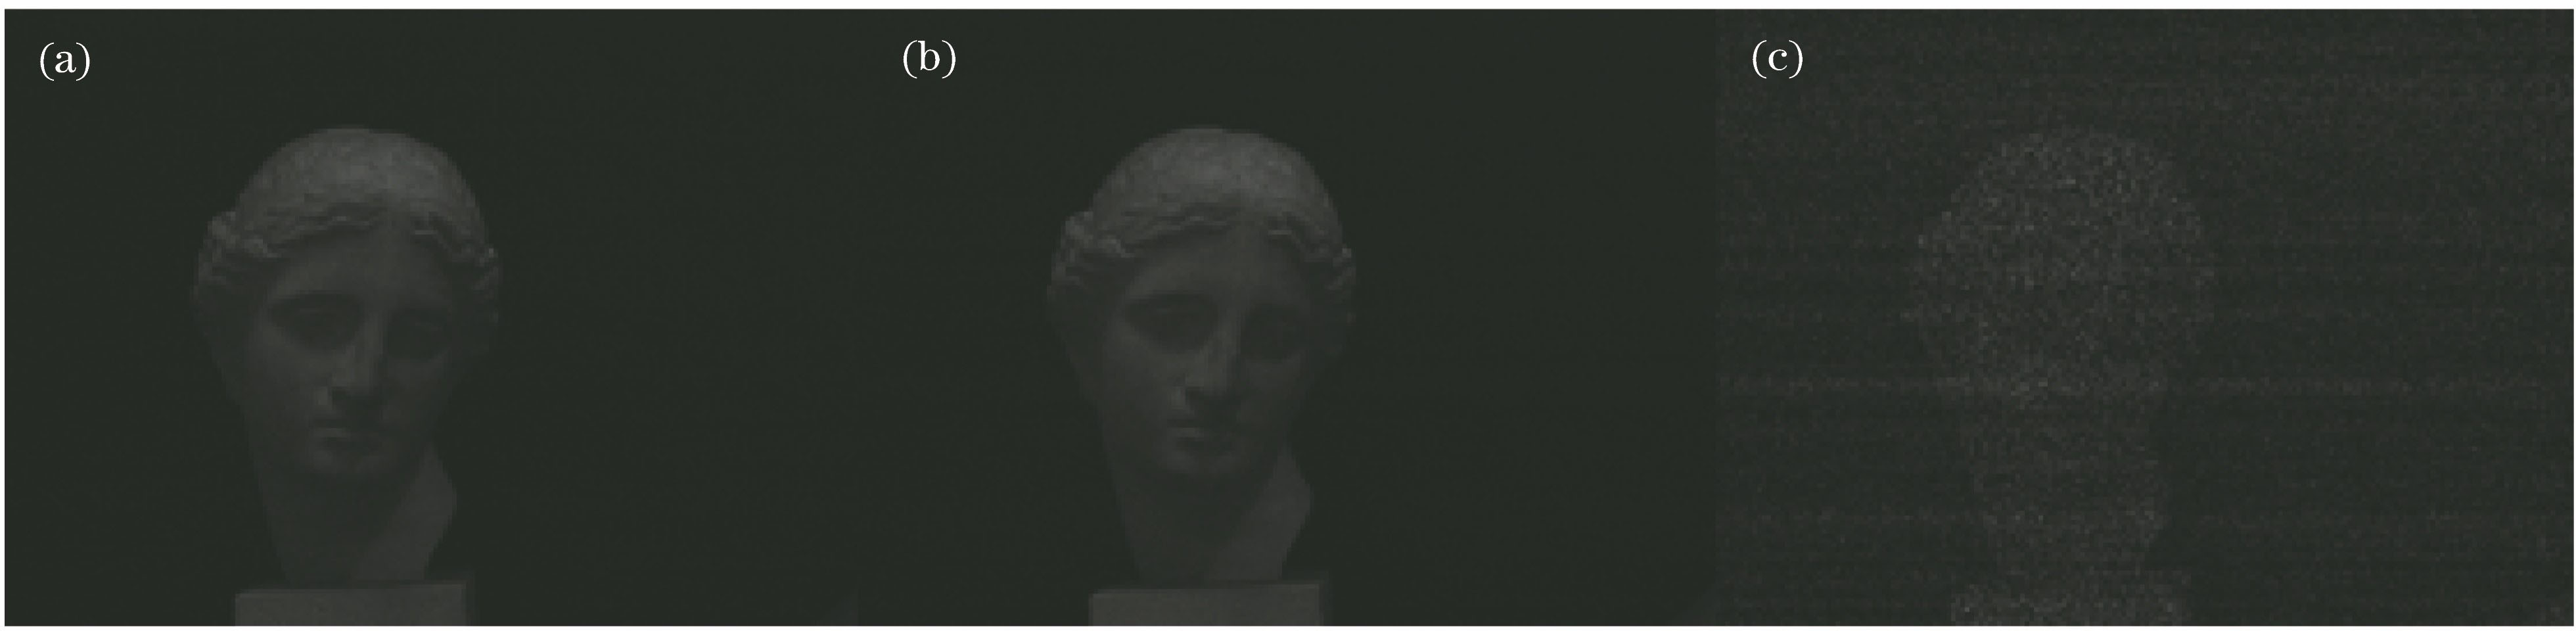
    Fig. 2. Plaster pictures collected by camera. (a) 1st picture collected; (b) picture collected 2 ms later; (c) effect of magnifying gray difference of picture by 10×
    Influence of presence or absence of ambient light on phase under different phase shift steps. (a) 3 steps phase shifting; (b) 18 steps phase shifting
    Fig. 3. Influence of presence or absence of ambient light on phase under different phase shift steps. (a) 3 steps phase shifting; (b) 18 steps phase shifting
    Processing results of picture pixels. (a) Average gray-scale sequence; (b) Fourier transform results (local)
    Fig. 4. Processing results of picture pixels. (a) Average gray-scale sequence; (b) Fourier transform results (local)
    Equation curve of average grayscale with time
    Fig. 5. Equation curve of average grayscale with time
    Schematic of phase compensation process
    Fig. 6. Schematic of phase compensation process
    Aimulate dephasing results of ambient light and noise images at different times and with different intensity noises. 0 ms, (a) 1 pixel intensity noise, (b) 0.4 pixel intensity noise; 4 ms, (c) 1 pixel intensity noise, (d) 0.4 pixel intensity noise; (e) grating fringe pattern at 10 ms; (f) phase of grating fringe pattern
    Fig. 7. Aimulate dephasing results of ambient light and noise images at different times and with different intensity noises. 0 ms, (a) 1 pixel intensity noise, (b) 0.4 pixel intensity noise; 4 ms, (c) 1 pixel intensity noise, (d) 0.4 pixel intensity noise; (e) grating fringe pattern at 10 ms; (f) phase of grating fringe pattern
    Phase error comparison before and after algorithm is processed under influence of different noise levels. (a) Noise variance is 0.4 pixel intensity; (b) noise variance is 1.0 pixel intensity
    Fig. 8. Phase error comparison before and after algorithm is processed under influence of different noise levels. (a) Noise variance is 0.4 pixel intensity; (b) noise variance is 1.0 pixel intensity
    Three-dimensional reconstruction of image and point cloud. (a) Plaster portrait collected by high-speed camera; (b) phase of plaster portrait; 18 steps phase shifting collection, (c) no ambient light source, (d) fluorescent lamp situation; 3 steps phase shifting collection, (e) no ambient light source, (f) fluorescent lamp situation
    Fig. 9. Three-dimensional reconstruction of image and point cloud. (a) Plaster portrait collected by high-speed camera; (b) phase of plaster portrait; 18 steps phase shifting collection, (c) no ambient light source, (d) fluorescent lamp situation; 3 steps phase shifting collection, (e) no ambient light source, (f) fluorescent lamp situation
    Standard spherical point cloud and fitting residual distribution. Without ambient light source, (a) 18 steps phase shifting reconstruction results, (c) 3 steps phase shifting reconstruction results; with ambient light source, (b) 3 steps phase shifting and reconstruction by using proposed algorithm after compensation results, (d) 3 steps phase shifting reconstruction results
    Fig. 10. Standard spherical point cloud and fitting residual distribution. Without ambient light source, (a) 18 steps phase shifting reconstruction results, (c) 3 steps phase shifting reconstruction results; with ambient light source, (b) 3 steps phase shifting and reconstruction by using proposed algorithm after compensation results, (d) 3 steps phase shifting reconstruction results
    MethodRadius stanard error /mmRadius max error /mmRadius measured /mm
    18 steps with no environment light0.0320.14350.8098
    3 steps with environment light0.3501.64050.6811
    3 steps with environment light and proposed method0.2200.95050.7481
    3 steps with no environment light0.2000.82050.7683
    Table 1. Standard ball measurement results and residual error analysis
    Yipeng Xiao, Chaoxia Shi, Feipeng Da. Periodic Light Disturbance in Fringe Projection Profilometry[J]. Acta Optica Sinica, 2020, 40(15): 1512002
    Download Citation