
Tian Shuai, Ren Yafei, Shao Xinye, Shao Jianlong. Multi-Focus Image Fusion with Filter Operator and Double Scale Decomposition[J]. Laser & Optoelectronics Progress, 2021, 58(6): 610010
- Laser & Optoelectronics Progress
- Vol. 58, Issue 6, 610010 (2021)
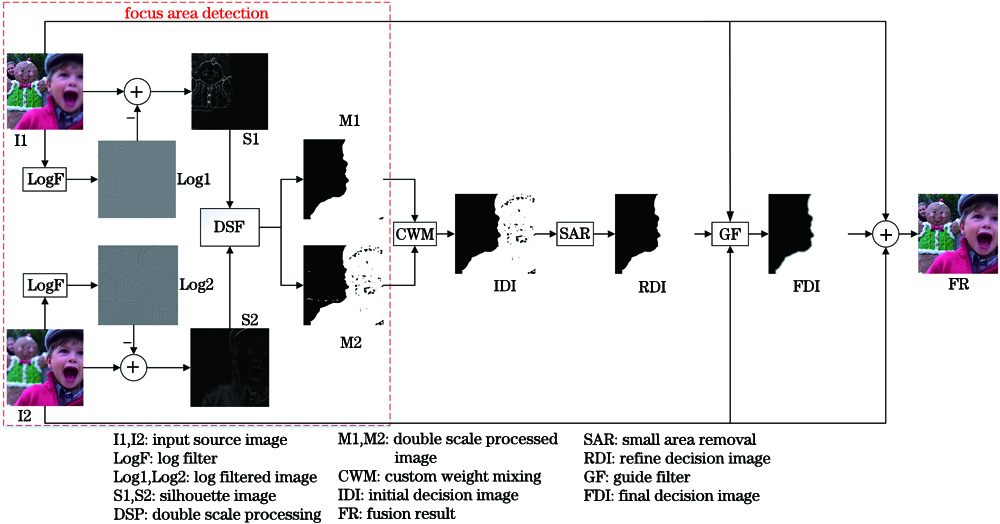
Fig. 1. Flow chart of fusion algorithm
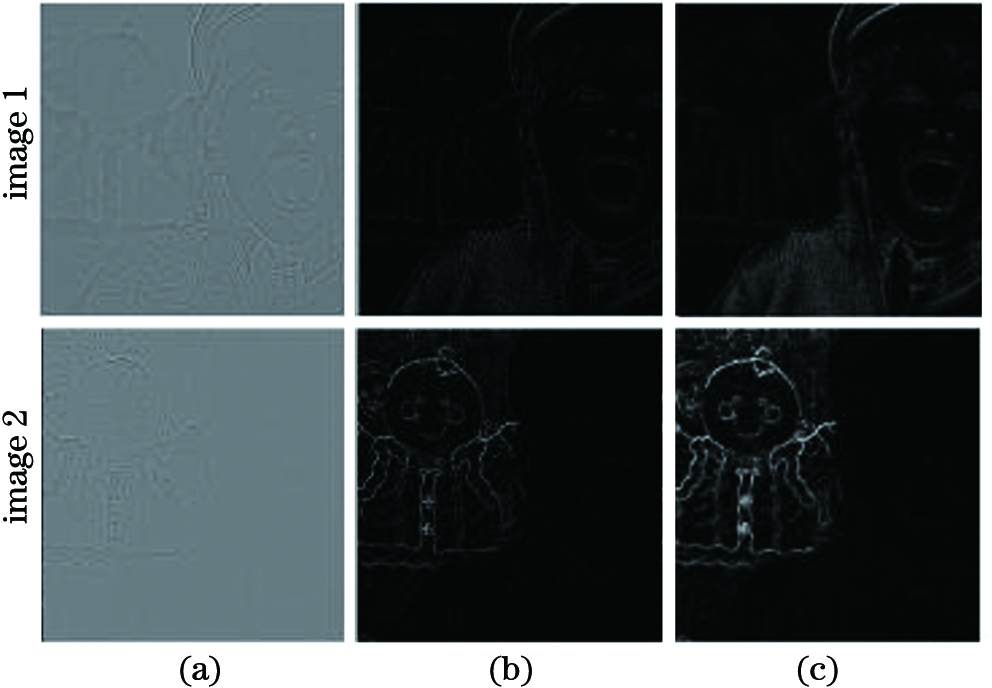
Fig. 2. Images after pretreatment. (a) Filtered images; (b) binary images of filtered image; (c) differential images
Fig. 3. Double scale decomposition and mixing. (a)(b) Source image; (c) small-scale focusing diagram; (d) large-scale focusing diagram; (e) initial decision diagram
Fig. 4. Results of different r values processing
Fig. 5. Results of guided filtering and fusion. (a) Refined decision graph; (b) refined fusion graph; (c) final decision graph; (d) fusion result
Fig. 6. Images of part of common dataset used in experiment
Fig. 7. Decision graphs and fusion results obtained by different detection methods. (a) I1; (b) MWGF; (c) Ref. [24]; (d) CNN; (e) Ref. [27]; (f) GFDF; (g) proposed algorithm
Fig. 8. Residual images between I1 and fused image obtained by different algorithms. (a1)(a2) I1; (b1)(b2) NSCT_SR; (c1)(c2) MGFF; (d1)(d2) proposed algorithm
Fig. 9. Residual images between focused image and fused image obtained by proposed algorithm
Fig. 10. Influence of w on fusion index
Fig. 11. Influence of r on fusion index
Fig. 12. Influence of ε on fusion index
|
Table 1. Comprehensive evaluation results of 27 groups of color images
|
Table 2. Comprehensive evaluation results of 13 gray scale images
|
Table 3. Average time calculated by different algorithms unit: s

Set citation alerts for the article
Please enter your email address
© Copyright 2018-2021 | Chinese Laser Press. All Rights Reserved 沪ICP备15018463号-20