We develop a hybrid optofluidic microcavity by placing a microsphere with a diameter ranging from 1 to 4 μm in liquid-filled plano-plano Fabry–Perot (FP) cavities, which can provide an extremely low effective mode volume down to μ while maintaining a high -factor up to and a finesse of ~. Compared to the pure plano-plano FP cavities that are known to suffer from the lack of mode confinement, diffraction, and geometrical walk-off losses as well as being highly susceptible to mirror misalignment, our microsphere-integrated FP (MIFP) cavities show strong optical confinement in the lateral direction with a tight mode radius of only 0.4–0.9 μm and high tolerance to mirror misalignment as large as 2°. With the microsphere serving as a waveguide, the MIFP is advantageous over a fiber-sandwiched FP cavity due to the open-cavity design for analytes/liquids to interact strongly with the resonant mode, the ease of assembly, and the possibility to replace the microsphere. In this work, the main characteristics of the MIFP, including -factor, finesse, effective mode radius and volume, and their dependence on the surrounding medium’s refractive index, mirror spacing, microsphere position inside the FP cavity, and mirror misalignment, are systematically investigated using a finite-element method. Then, by inserting dye-doped polystyrene microspheres of various sizes into the FP cavity filled with water, we experimentally realize single-mode MIFP optofluidic lasers that have a lasing threshold as low as a few microjoules per square millimeter and a lasing spot radius of only ~μ. Our results suggest that the MIFP cavities provide a promising technology platform for novel photonic devices and biological/chemical detection with ultra-small detection volumes.
1. INTRODUCTION
As a highly sensitive way to detect tiny changes in analytes, optofluidic lasers are being used as an emerging technology for biological/chemical analysis [1,2]. In the past few years, various configurations of optical microcavities have been exploited in a fluidic environment to achieve optofluidic lasers, such as ring resonators [3–10], distributed feedback gratings [11–13], and Fabry–Perot (FP) cavities [14–21]. Among them, ring resonators and FP cavities are attracting tremendous attention owing to their high quality factor (-factor), small mode volume, and good compatibility with fluidic channels. Nevertheless, these microcavities also have certain disadvantages and limitations. For ring resonators (e.g., microdroplets [4,9], microcylinders [3], and microcapillaries [5–7]), optical resonance, i.e., whispering gallery mode (WGM), forms due to total internal reflection at the dielectric interface. However, the -factor of the ring resonator depends on the refractive index (RI) contrast and resonator size [22], which imposes the lower limit for the size that a ring resonator can achieve. For example, when the ring diameter decreases to less than 6 μm, the significantly increased bending loss results in a drastic decrease in the -factor, and hence there is an increase in the lasing threshold. In contrast, plano-concave FP (PCFP) cavities are able to provide an extremely small mode volume by reducing the cavity length to a few micrometers and the curvature radius of the concave mirror to a few tens of micrometers [18,23–25]. For example, by using concave mirrors with a curvature radius of 4 μm and adjusting mirror separation to 1 μm, a mode volume down to (μ) with a high -factor of 18,000 has recently been reported [26]. However, fabrication of such microscopic concave spherical mirrors with low surface roughness still remains complex, difficult, and costly. Unfortunately, while plano-plano FP (PPFP) cavities are much easier to fabricate and readily available, they lack lateral confinement, leading to a large mode volume, and are highly susceptible to optical misalignment.
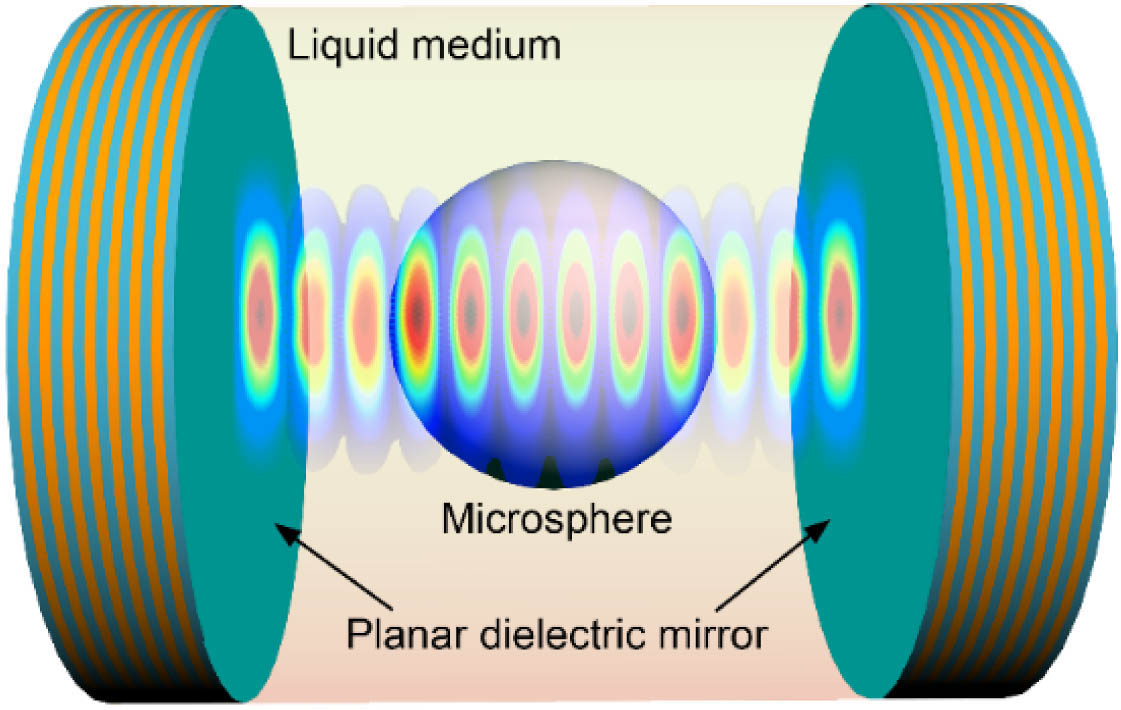
Here, we demonstrate a hybrid optofluidic cavity by placing a polystyrene microsphere (MS, ) ranging from 1 to 4 μm in diameter in a liquid-filled PPFP cavity (Fig. 1), which can provide an extremely low effective mode volume down to μ and a tight mode radius of 0.4–0.9 μm while maintaining a high up to and a finesse of , when the RI contrast of MS liquid is optimized around 1.026 (1.6:1.56). As discussed in detail later, our study shows that the MS plays three important roles in this microsphere-integrated FP (MIFP) cavity. First, it serves as an excellent “waveguide” to laterally confine light, thus ensuring a small mode radius (0.26–0.9 μm) and hence a small mode volume [femtoliter (fL) to sub-fL]. Second, unlike conventional cylinder-like waveguides (e.g., microfibers) in which the light emitted from the endface diverges considerably due to diffraction [27], the MS has the lensing (or focusing) effect [28–32] to counteract the expansion of the beam caused by diffraction. Consequently, the small beam size can be maintained even at a distance the MS diameter. Third, it is well known that pure PPFP cavity without an MS suffers easily from geometrical walk-off loss when the two plane mirrors are misaligned with respect to each other [33]. With an MS, the walk-off light can be refracted or reflected back into the cavity owing to the spherical geometry of the MS, making the MIFP cavity much more tolerant to the relatively large mirror misalignment (e.g., the tilt angle can be as large as 1°–2°). Finally, high-quality MSs of various sizes, RIs, and dopants and planar mirrors with various reflectivities are commercially available, which significantly simplifies the processes and reduces the cost associated with the construction of an MIFP.
Figure 1.Schematic of an MIFP cavity, in which an MS is inserted in an FP cavity filled with liquid.
In this work, we first use the Comsol Multiphysics finite element method to systematically investigate various characteristics of the MIFP, including -factor, finesse, effective mode radius and volume, and the dependence on surrounding medium RI, mirror spacing, MS position, and mirror misalignment. Then we experimentally achieve the MIFP-based single-mode optofluidic lasers with a low lasing threshold of μ and a lasing mode radius of approximately 0.5 μm.
Sign up for Photonics Research TOC. Get the latest issue of Photonics Research delivered right to you!Sign up now
2. THEORETICAL ANALYSIS AND SIMULATION
The mathematical model is illustrated in Fig. 2(a), in which an MS of a diameter and an RI is immersed in a liquid with an RI of and sandwiched between two mirrors with a spacing of . As shown in Fig. 2(b), each mirror is formed by 15 dielectric layers alternating between high-RI (, ZnS) and low-RI (, ) layers with the first and last layer having high RI. The thickness of the high-RI () and low-RI () layer is determined by . The central optical wavelength is chosen to be 540 nm in this work. Figure 2(c) gives a reflectance spectrum of the 15-layer mirror (red line) as well as the 7-layer (green line) and 11-layer (blue line) mirrors for comparison. It can be seen that the 15-layer mirror shows a broadband flat reflectivity of about 99.88% across a range of wavelengths from 500 to 580 nm, whereas the 7-layer and 11-layer mirrors give a reflectance of roughly 99% and 93.6%, respectively.
Figure 2.(a) and (b), (d)–(g) Schematic and representative electrical field distribution of the fundamental resonant mode of (a) and (b) MIFP, (d) and (e) finite PPFP, and (f) and (g) WGM cavities, respectively. is the diameter of the MSs and also the diameter of the circular mirrors. is the mirror spacing. For the MIFP cavity, the MS is assumed in the center of the two mirrors. In (b), (e), and (g), the parameters are μ, μ, and . The symmetrical axis is set in the 2D-axisymmetric model, indicating the geometry on the right side is assumed to rotate around the axis, rendering a quasi-3D model. PMLs are boundaries where the calculation is terminated. Integration line in (b) is plotted across the vertical center of the freestanding wave node closest to the bottom mirror and is used to calculate the effective mode radius. (c) Reflectance spectra of 7-, 11-, and 15-dielectric-layer mirrors across a wavelength range of 400 to 800 nm. (h) -factor of MIFP, finite PPFP, and WGM cavities as a function of . There are two variables ( and ) for the MIFP cavity and the PPFP cavity. For a given , is chosen to be as close to as possible and with maximum calculated -factor for the MIFP cavity in a range of from to μ, since the -factor oscillates over with a period of about 0.28 μm.
The MIFP cavity is calculated with a 2D axisymmetric formulation available in the Electromagnetic Waves, Frequency Domain interface within the Wave Optics modules. An eigenfrequency study is used for solving the cavity resonance frequency, -factor, finesse, and effective mode radius and volume. Perfectly matched layers (PMLs) backed by a scattering boundary condition are applied at the outer domains, indicating the termination of calculation [Fig. 2(b)]. Convergence tests are conducted before determining the final PML thickness and mesh size to avoid numerical instabilities.
The effective mode volume is defined as [34] where is the dielectric constant, is the electric field strength, and is the volume bound between two dielectric mirrors encompassing the MS and its surrounding medium. Similarly, the effective mode radius is defined as where is chosen to be the line across the vertical center of the freestanding wave node closest to the bottom mirror [as shown in Fig. 2(b)]. The longitudinal mode number () is determined by counting standing wave nodes in the mode profile. Thus, the finesse can be estimated by
A. Q-Factor Comparison Among MIFP, PPFP, and WGM
Since the MIFP cavity is a combination of PPFP and MS (which also supports the WGM), it is insightful to compare the -factor of these three types of cavities and show the advantages of the MIFP cavity. Figure 2 gives a schematic and calculated resonant mode profile for MIFP [Figs. 2(a) and 2(b)], PPFP [Figs. 2(d) and 2(e)], and WGM [Figs. 2(f) and 2(g)] cavities in a water medium (), respectively. It can be seen that the MIFP cavity (μ, μ) provides strong light confinement in the lateral direction with a mode radius of about 0.47 μm and a -factor of .
Regarding the PPFP cavity, we consider two cases: one is a PPFP cavity with infinite-sized mirrors; the other is with finite-sized mirrors. In the first case, the energy loss originates merely from mirror reflection loss and there is no diffraction or geometrical walk-off loss [33,35–37]. Therefore, the -factor is simply given by [38]where is the refractive index of the medium inside the PPFP cavity, is the mirror spacing, is the optical wavelength, and and are the power reflectivity of the two mirrors. Substituting , μ, and into Eq. (4), ,787 is derived. In the second case, for a fair comparison, the finite PPFP cavity [Figs. 2(d) and 2(e)] is assumed to have the same mirror size and cavity length as the MIFP cavity [see Figs. 2(a) and 2(b)]. The diffraction walk-off loss (i.e., light beam inevitably expands when travelling in free space, leading to spillover at the beam or mirror edges after multiple round-trips between the mirrors) should be also taken into account [33,35–37]. As shown in Fig. 2(e), a considerable fraction of light leaks into the outer PML, resulting in a significant diffraction loss and a reduced -factor, .
Regarding the WGM cavity (i.e., the MS acts as a ring resonator), Fig. 2(g) gives a representative electrical field distribution of a fundamental TE mode for a 3-μm diameter MS in water, showing a large fraction of light leaking into the PML and a resultant -factor, .
Figure 2(h) shows more comparison data in terms of the -factor among the MIFP, finite PPFP, and WGM cavities as a function of (note: is the diameter of the MS and also the FP mirror diameter). Again, all three types of cavities are in the aqueous environment (). It can be seen that the MIFP cavity has a much larger -factor, 3–20 times that for the finite PPFP and the WGM. Although the MIFP cavity -factor is only 18% of that for the infinite PPFP () at μ, the MIFP cavity provides the strongest lateral mode confinement with an ultra-small mode radius of 0.38 μm and effective mode volume of μ. The effective mode volumes for the finite PPFP cavity and the WGM cavity at μ are μ and μ, respectively, which are 10–15 times larger than that for the MIFP cavity, due to much weaker mode confinement. Furthermore, by reducing the RI contrast of the MS and surrounding medium, the MIFP cavity -factor can be about 5 times larger, which is quite close to that of the PPFP, as will be discussed in more detail in the following sections.
B. Multiple Modes and Their Q-Factors and Mode Volumes over Liquid RI
Just as fibers support multiple guided modes, an MIFP cavity may support multiple transverse modes. Figures 3(a)–3(d) give a cross-sectional and vertical-sectional mode profile of the , , , and mode of an MIFP cavity with a 2-μm diameter MS placed in a 2.04-μm-long FP cavity and surrounded by a medium with an RI . Note that it may be difficult to distinguish the , , and modes (all belong to the mode) simply by their electrical field distribution, since Figs. 3(b)–3(d) show nearly the same mode profile. Fortunately, these three modes are calculated by setting different azimuthal numbers in the 2D-axisymmetric model with a value of 0 for and and 2 for the mode. To further distinguish those modes, the polarization of the modal field [shown as white arrows in Figs. 3(b)–3(d)] is introduced by plotting the in-plane electrical field vector in the cross-sectional view, which provides clear evidence to confirm those modes.
Figure 3.(a)–(d) Electrical field distribution of the (a) , (b) , (c) , and (d) modes of an MIFP cavity with a 2-μm diameter MS placed in a 2.04-μm-long FP cavity (μ, μ, ). Upper and lower panels are the cross-sectional and vertical-sectional view, respectively. White arrows indicate the in-plane electrical field vector in the cross-sectional view. (e)–(g) -factor of the , , , and modes as a function of surrounding medium RI for three different MIFP structures: (e) 1-μm MS in 1.04-μm-long cavity (μ, μ), (f) 2-μm MS in 2.04-μm-long cavity (μ, μ), and (g) 4-μm MS in 4.06-μm-long cavity (μ, μ). The diameter of the mirrors is set to be 2 μm larger than that of the corresponding MS.
The -factor for the above four modes on RIs with different surrounding media () is investigated. Three different MIFP structures are selected, including a 1-μm diameter MS in a 1.04-μm-long cavity [μ, μ in Fig. 3(e)], a 2-μm diameter MS in a 2.04-μm-long cavity [μ, μ in Fig. 3(f)], and a 4-μm diameter MS in a 4.06-μm-long cavity [μ, μ in Fig. 3(g)]. It can be seen that, with the increased surrounding medium RI, , the -factors of the three MIFP structures show an overall increasing trend, which is attributed to the reduced reflection and refraction loss caused by the reduced RI contrast. Most importantly, the maximum -factors can be very close to that of the infinite PPFP cavities. For example, for the 4.06-μm-long MIFP, the maximum -factor is about 59,900 [at , Fig. 3(g)], whereas the 4.06-μm-long infinite PPFP cavity has a -factor of 62,100, as calculated by Eq. (4). It can also be concluded from the figures that, in most cases, the mode possesses the largest -factor, the mode next, the mode third, and the mode has the lowest. Besides, for a small “waveguide” such as 1-μm- and 2-μm-diameter MSs, when the surrounding medium RI increases to a value close to that of the MS [e.g., 1.5–1.58 in Figs. 3(e) and 3(f)], the -factors of higher-order modes (, , and ) decrease, which is due to the fact that such a low RI contrast can no longer support the higher-order modes or the mode confinement becomes quite weak with a mode size larger than the preset mirror size, leading to an extra spillover loss (Fig. 4).
Figure 4.Electrical field distribution of the mode of the MIFP cavity in Fig. 3(e) (μ, μ) (a) before and (b) after the -factor drop as the surrounding medium RI increases from (a) 1.5 to (b) 1.52. It can be seen that the mode confinement in (b) becomes quite weak with a large portion of the eletrical field leaking into the PML layer, leading to an extra spillover loss and a decreased -factor.
The effective mode radius and volume of the MIFP cavity with different are also investigated, as listed in Table 1. It shows that and decrease monotonically with decreasing . Consequently, optical energy is more confined in the lateral direction. The mode volumes for the three MIFP structures (μ, μ; μ, μ; μ, μ) at are 0.084–0.334, 0.290–1.366, and μ, which are comparable to or even better than that for a conventional PCFP cavity (μ in Ref. [26], μ in Refs. [18,23–25]). The mode volume and -factor increase with increasing surrounding medium RI, , reflecting the trade-off between mode confinement and cavity loss. When increases from 1.33 to 1.56 or 1.58, although the mode radius increases by 1.17–2 times and the effective mode volume increases by about 4 times, the -factor can increase by 6–16 times. Therefore, in certain applications it may be worthwhile to increase the surrounding medium RI for a much higher -factor with a slightly increased, but still extremely small, mode radius and volume.
d (μm)
L (μm)
na
Q-factor
Finesse
rm (μm)
Veff (μm3)
1
1.04
1.33
757.7
126.3
0.261
0.084
1.4
1165.6
194.3
0.275
0.098
1.5
3264.2
544
0.316
0.150
1.56
12037
2006.2
0.422
0.334
2
2.04
1.33
2354.1
196.2
0.326
0.290
1.4
3654.4
304.5
0.339
0.362
1.5
8003.5
667.0
0.381
0.568
1.58
26710
2225.8
0.556
1.366
4
4.06
1.33
3387.8
141.2
0.457
1.169
1.4
19771
823.8
0.476
1.489
1.5
20273
844.7
0.571
2.232
1.58
59875
2494.8
0.853
5.144
Table 1. -Factor, Finesse, Mode Radius, and Mode Volume ( Mode) of MIFP Cavity at a Wavelength around 540 nma
Generally, for many applications such as biological/chemical sensing, a desired optofluidic microcavity should ensure strong interaction between the cavity mode and the analytes to be detected. For the MIFP cavity with an MS fully attached to the two mirrors (, e.g., Fig. 3), the cavity modes are mostly distributed inside the MS. In order to achieve light–matter interaction, an MS consisting of functional materials permeable or semi-permeable to the analytes can be exploited [39]. An alternative way is to construct an MIFP cavity with the cavity length 1.5–2 times larger than the diameter of the MS and thus allow for sufficient space for analytes/liquids to move into and out of and interact strongly with the resonant mode. In this section and Section 2.D, we investigate the dependence of the -factor on the cavity length and the position of the MS, , in the MIFP cavity with a fixed MS diameter μ [see Fig. 5(a) for schematic illustration]. In this section, we vary the cavity length while fixing the MS position at μ.
Figure 5.(a) Schematic of an MIFP cavity with the cavity length larger than the MS diameter . is the distance from the MS center to the bottom mirror. (b) Electrical field amplitude distribution of the mode for MIFP cavities (μ, μ) with cavity lengths μ and 8 μm under a surrounding medium RI of 1.33, 1.4, and 1.5, respectively. (c)–(e) Calculated -factor of mode for MIFP cavities (μ, μ) as a function of cavity length at (c) , (d) , and (e) , respectively. In the observation window of 520–560 nm for the resonance wavelength, there are usually two modes with consecutive longitudinal mode numbers but different . For clarity, we divide them into two groups. The red circle line corresponds to even longitudinal mode numbers (), and the blue circle line corresponds to odd longitudinal mode numbers (). (f)–(h) Calculated -factor of the , , and modes for MIFP cavities (μ, μ) as a function of cavity length at (f) , (g) , and (h) , respectively.
Figure 5(b) shows 6 representative electrical field distributions of the mode for the MIFP cavity with cavity lengths of 6 μm and 8 μm under a surrounding medium RI of 1.33, 1.4, and 1.5, respectively. It can be seen that, when the cavity length increases to μ, the “waveguiding” effect persists with a “cylinder-like” mode profile: the mode radius inside and outside the MS remains nearly the same. When the cavity length further increases to μ, only at , the cylinder-like mode profile is maintained, whereas at and , the mode profile shows a cone or trapezoidal shape with a significant fraction of light leaking into lateral sides, especially for the case.
Figures 5(c)–5(e) present the -factor of the mode over different cavity lengths at [Fig. 5(c)], [Fig. 5(d)], and [Fig. 5(e)], respectively. Again, the position of the MS is fixed at μ. As the cavity length increases, the observed longitudinal mode number increases from 24 to . In most cases, there are two longitudinal modes in the range of 520–560 nm with consecutive but different -factors, so we divide them into (denoted by red circles) and (denoted by blue circles) for clarity. It can be seen that the envelope of the -factor curve begins to drop significantly when the cavity length increases beyond 6 μm for , 7 μm for , and 9 μm for , indicative of the beginning of the deteriorated “waveguiding” effect. The -factor curves of the , , and modes [Figs. 5(f)–5(h)] show a trend similar to those of the mode [Figs. 5(c)–5(e)].
The above-mentioned deteriorated “waveguiding” phenomenon is attributable to the focusing effect of the MS (also known as “photonic nanojet” [28–32,40–42]). When a plane wave or a Gaussian beam is incident on an MS, a focusing spot (or “nanojet”) with an elongated shape and small lateral size is formed. The focusing length depends on the MS diameter and RI contrast between the MS and the surrounding medium. The smaller RI contrast, the longer focusing length [Figs. 6(a)–6(c)]. The “focusing lengths” for , 1.4, and 1.5 are 2, 3, and 5.7 μm, respectively. As long as a mirror is placed within the focusing length of the MS, the forward light travels in a convergent manner and is reflected back almost totally into the MS again [Fig. 6(d)]. On the other hand, if a mirror is placed beyond the focusing length of the MS, the forward light travels in a divergent manner and only a portion of it is reflected back into the MS [Fig. 6(e)], resulting in a low reflecting efficiency and hence a low -factor.
Figure 6.(a)–(c) Photonic nanojet formation by a 4-μm diameter polystyrene MS illuminated by a Guassian beam (μ) with a surrounding medium RI of (a) , (b) , and (c) . The point with the maximal electric field amplitude is chosen to be the focusing point. The focal length here is defined as the distance from the bottom of the MS to the focusing point. (d) Reflected light field distribution when the “nanojet” formed in (a) is incident on a mirror placed within the focusing length of the MS at . Most of the light field is reflected back into the MS. (e) Reflected light field distribution when the “nanojet” formed in (a) is incident on a mirror placed beyond the focusing length of the MS at . A large portion of the light field misses the MS. For a better understanding, the nanojet formation is simplified as a focusing lens in ray optics, as shown in insets of (d) and (e). Schematics show how light propagates when the mirror is placed within [inset of (d)] and outside [inset of (e)] the focusing plane.
It is easily seen that with the MS waveguide inserted between the two mirrors an MIFP cavity functions like an all-fiber FP cavity [43] or micropillar cavity [44]. However, for those cavities, Bragg mirrors are grown on the two ends of the fiber or pillar, making them all-solid and closed cavities. In contrast, in an MIFP cavity, the MS is separated from the mirrors. Consequently, such an open cavity is accessible to molecules delivered from the outside.
D. Q-Factors over MS Position b0
Now we discuss how the MS position in an MIFP cavity affects the -factor for a fixed cavity length . Figures 7(a)–7(c) show the dependence of the -factor of the , , , and modes on at [Fig. 7(a)], [Fig. 7(b)], and [Fig. 7(c)] for MIFP cavities with μ and μ, respectively. Quasi-periodic oscillations with respect to can be observed in these figures (Fig. 7) with a period of 200–280 nm, which approximately equals the length of one free-standing wave node. In one period, for different MS positions, the wave front may match with the spherical boundary differently, thus causing different refraction or scattering loss, corresponding to the oscillatory -factor. Note that the same oscillatory phenomenon occurs as well in Figs. 5(c)–5(h) with respect to the cavity length when is fixed. Ignoring these oscillations, we can see that the envelope of the -factor curves does not change significantly over different for the MIFP cavity with the cavity length fixed at μ. In contrast, for the MIFP cavity with the cavity length fixed at μ [Figs. 7(d)–7(f)], the MS position affects the -factor much more dramatically. As shown in Fig. 7(d) (), when the MS is placed near the center of the FP cavity (μ), the -factor reaches the maximum value of 7370 ( mode), more than 30 times larger than that for an MS positioned at the ends of the cavity (μ). The inset in Fig. 7(d) gives the mode profile at μ, showing good confinement in the lateral direction. For [Fig. 7(e)] and [Fig. 7(f)], the -factor of the mode reaches the maximum at μ and 4.98 μm, respectively. Besides, the -factor of the higher-order modes (, , and ) is much smaller than that of the mode [Figs. 7(e) and 7(f)], due possibly to the smaller RI contrast and weaker confinement.
Figure 7.(a)–(c) Calculated -factors of the , , , and modes as a function of [the distance from the MS center to the bottom mirror, illustrated in Fig. 5(a)] at (a) , (b) , and (c) for the MIFP cavity with fixed μ and μ. (d)–(f) Calculated -factors of the , , , and modes as a function of at (d) , (e) , and (f) for the MIFP cavity with fixed μ and μ. Insets in (d) and (e) show the mode profiles at μ and 4.48 μm, respectively.
It is known that the PPFP cavity is highly susceptible to optical misalignment (i.e., one mirror tilts with respect to the other), which leads to geometrical walk-off loss and decrease in the -factor [18,33]. In this section, we investigate how the -factor of an MIFP cavity is affected by misaligned mirrors, as illustrated in Fig. 8(a). It should be mentioned that since the tilted mirror structure is not cylinder-symmetric, the 2D-axisymmetric formulation used previously is no longer applicable and thus needs to be replaced by a 2D model, which in fact calculates an infinite cylinder (instead of an MS) lying between the two mirrors. Here we only use this 2D model as an approximation of the MIFP cavity and focus on the relative value instead of absolute value of the -factor. Figure 8(b) gives a representative mode profile of an MIFP cavity (μ, μ, ) with the top mirror tilted by 2°. The beam in the upper part (outside the MS) is perpendicular to the top mirror, while the beam in the lower part (mainly inside the MS) is perpendicular to the bottom mirror. By refraction at the spherical interface, the MS nicely “bends” these two parts of the beam with little light leaking out into the background. Figures 8(c)–8(e) present the -factor of the fundamental mode under different tilting angles (, 1°, 2°) at [Fig. 8(c)], [Fig. 8(d)], and [Fig. 8(e)]. The cavity length is set to be 1, 1.5, and 2 times the MS diameter . It can be seen that for and 1.4, the -factor remains almost unchanged, whereas for , when increases to 2°, the -factor decreases to 20%–50% of its original value at , indicative of lower tolerance to mirror misalignment.
Figure 8.(a) Schematic of an MIFP cavity with the top mirror tilted by with respect to the bottom mirror. (b) Fundamental mode profile of an MIFP cavity (μ, μ, , ). (c)–(e) Comparison of the -factor of the fundamental mode under different tilting angles (, 1°, and 2°), and cavity length is set to be 1, 1.5, and 2 times the MS diameter at (c) , (d) , and (e) .
3. EXPERIMENTAL DEMONSTRATION OF MIFP-BASED OPTOFLUIDIC LASERS
Based on the high- MIFP cavity, we experimentally demonstrate an optofluidic laser by inserting fluorescent polystyrene MSs (FluoSpheres, Invitrogen) between two planar dielectric mirrors (Evaporated Coatings Inc.). The surrounding medium is water. The mirrors are designed with a reflection band at 510–580 nm () and a transmission band at 440–480 nm (). The non-fluorescent MSs with calibrated diameters are also used as spacers to define the cavity length. The MIFP cavities are pumped by a pulsed optical parametric oscillator (5 ns pulse width, 20 Hz repetition rate, wavelength 479 nm). Figure 9(a) shows typical lasing spectra for three different MIFP cavities using 4-μm (red line), 2-μm (blue line), and 1-μm (green line) fluorescent MSs doped with 12 mmol/L dye. Owing to the short cavity length (i.e., 4-μm cavity length corresponds to a free spectral range of about 20 nm), single-mode lasing with side-mode suppression ratios of 8, 54, and 21 was achieved for the 4-μm, 2-μm, and 1-μm MIFP cavity, respectively. Strong side-band suppression is particularly desirable for wavelength multiplexing and spectral interrogation in sensing applications. In addition, the 4-μm and 2-μm MIFP lasers exhibit an extremely narrow linewidth of about 0.22 nm, measured by a spectrometer with a resolution of 0.07 nm. The 1-μm MIFP cavity shows a broader linewidth of 0.512 nm, due probably to the lower -factor (Table 1). The insets of Fig. 9(a) give typical lasing modes seen in the above three MIFP cavities. For the 4-μm MIFP cavity, both the and modes are most frequently observed, whereas for the 2-μm and 1-μm MIFP cavities, only the mode can be observed, since all other modes have much lower -factors [see Figs. 3(e) and 3(f)]. The corresponding lasing thresholds of 1.9, 10, and μ can be deduced from Figs. 9(b) and 9(c), which are comparable to or even lower than the previously reported PPFP-based optofluidic lasers [14,18,21], despite a much lower effective gain volume of only μ (as calculated in Table 1). Note that although the lasing threshold of the 4-μm MIFP cavity is slightly higher than that achieved in the best PCFP laser of a similar cavity length [18] (μ versus μ), the MIFP cavity has a much lower mode volume (μ versus μ). Furthermore, the lasing threshold for the MIFP cavity can be further reduced by decreasing the MS-liquid RI contrast to increase the -factor, as discussed previously in our simulation.
Figure 9.(a) Lasing spectra for MIFP-based lasers constructed by inserting 4-μm (red line), 2-μm (blue line), and 1-μm (green line) diameter polystyrene MSs between the two mirrors. Insets show the images of the lasing modes. Scale bar, 2 μm. (b) Spectrally integrated laser output as a function of pump energy density for the 4-μm diameter MIFP (red) and 2-μm diameter MIFP (blue) cavity, respectively. (c) Spectrally integrated laser output as a function of pump energy density for the 1-μm diameter MIFP cavity.
The MIFP-based laser with the cavity length larger than the MS diameter is also investigated, as shown in Fig. 10. By using multiple 6-μm non-fluorescent MSs as spacers, the cavity length is set to be μ, 1.5 times larger than the MS diameter μ [inset of Fig. 10(a)]. The green lasing spot can be clearly seen, with the mode pattern and a spot radius of approximately 0.5 μm. Single-mode lasing is also achieved in this cavity, with a lasing threshold of μ [Fig. 10(b)], slightly larger than the MIFP cavity with μ. When the cavity length increases to 8 μm, no lasing can be observed in most cases, as predicted in the simulation results in Fig. 5(c).
Figure 10.(a) Lasing spectra under different pump intensity for MIFP-based lasers constructed by inserting a 4-μm diameter polystyrene MS (indicated by the dashed circle in the inset) into a 6-μm length FP cavity. The cavity spacing is controlled by using 6-μm diameter non-fluorescent MSs (indicated by the dashed circles in the inset). Scale bar, 4 μm. (b) Spectrally integrated laser output as a function of pump energy density for the MIFP-based laser in (a). Error bars are obtained by 3 measurements.
In summary, we have developed a novel microcavity platform based on MIFP cavities, in which the microsphere between the two mirrors acts as a waveguide and a lens. Compared to MSs and PPFP cavities, the MIFP cavity has a high -factor and a small mode volume. Different from the all-fiber FP cavity or the micropillar cavity, the MIFP cavity has open access, allowing for analytes/liquids to be delivered in/out and interact adequately with the resonant mode. In addition, the MIFP cavity can be constructed easily with high tolerance to mirror misalignment and low cost, and the microspheres doped with various dopants are readily available. Finally, we experimentally realize the MIFP-based optofluidic lasers in a water medium with single-mode emission, a low lasing threshold of μ, and a lasing mode radius of μ. Our work suggests that the MIFP cavity may be a promising candidate for broad applications in bio- and chemical-sensing with sub-fL detection volumes and miniaturized photonic devices.