• Laser & Optoelectronics Progress
  • Vol. 56, Issue 19, 191404 (2019)
Ming Pang* and Wendan Tan
Author Affiliations
  • Airport College, Civil Aviation University of China, Tianjin 300300, China
  • show less
    DOI: 10.3788/LOP56.191404 Cite this Article Set citation alerts
    Ming Pang, Wendan Tan. Numerical Simulation of Temperature Field During Laser Transformation Hardening Vermicular Graphite Cast Iron Based on Beam Discretization[J]. Laser & Optoelectronics Progress, 2019, 56(19): 191404 Copy Citation Text show less
    Two-dimensional discrete lattice spot
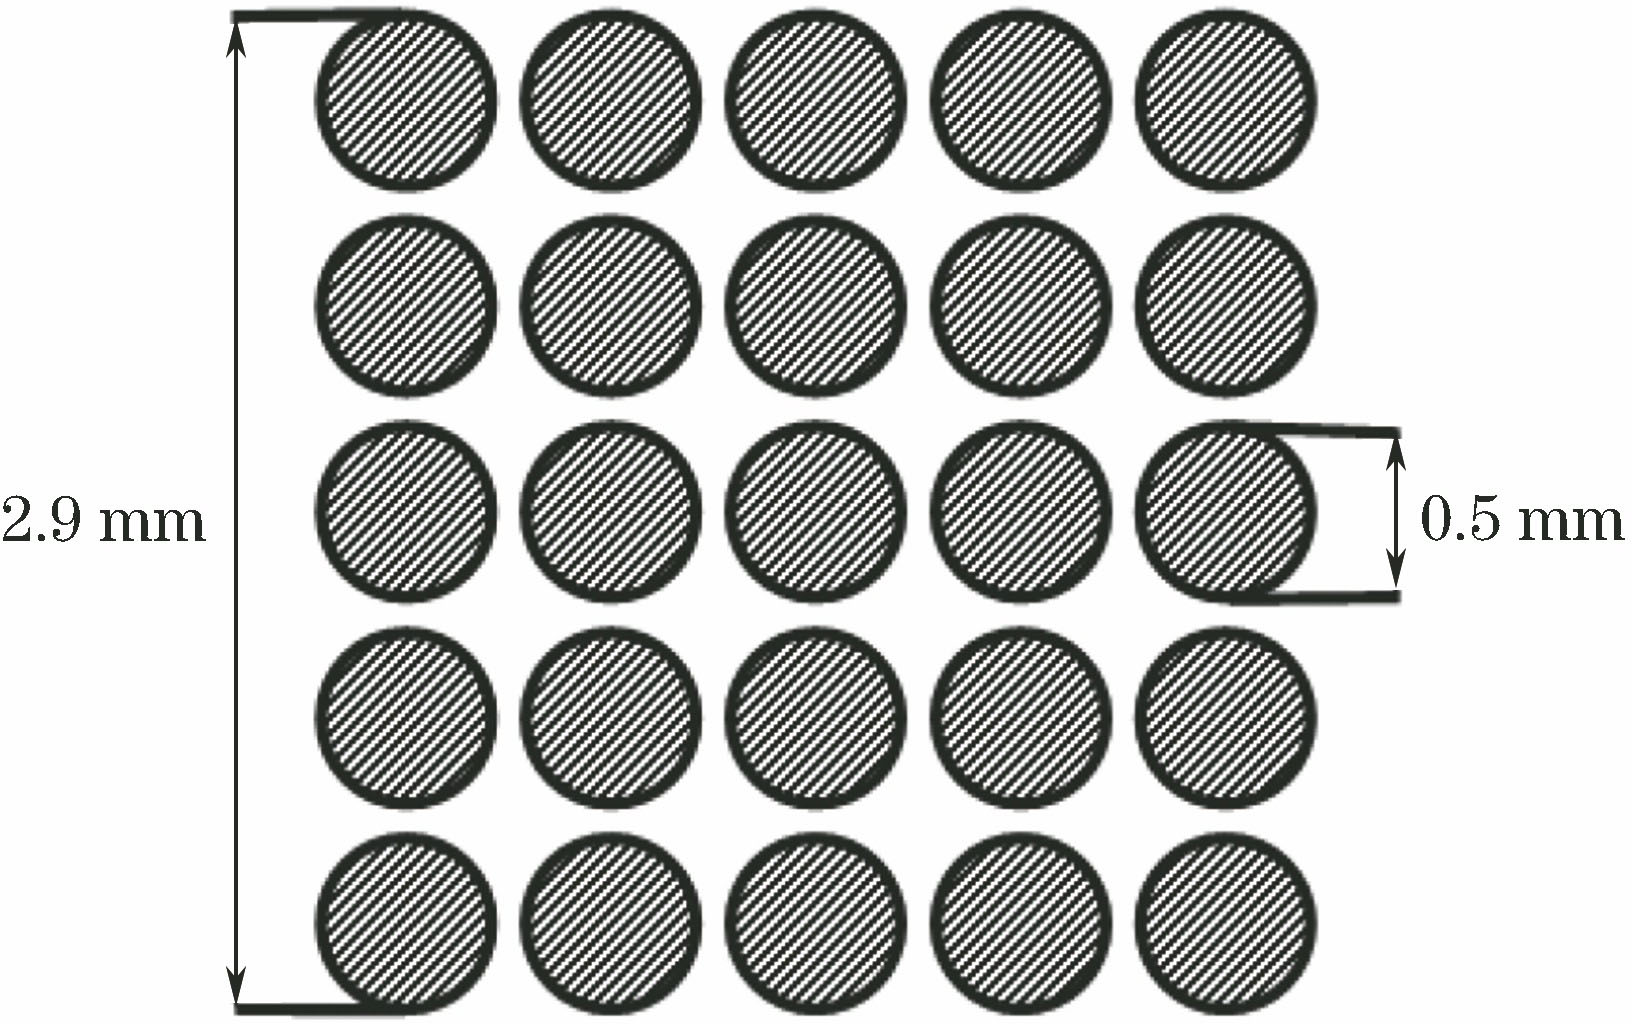
    Fig. 1. Two-dimensional discrete lattice spot
    Finite element model on account of numerical simulation of temperature field during laser transformation hardening based on beam discretization
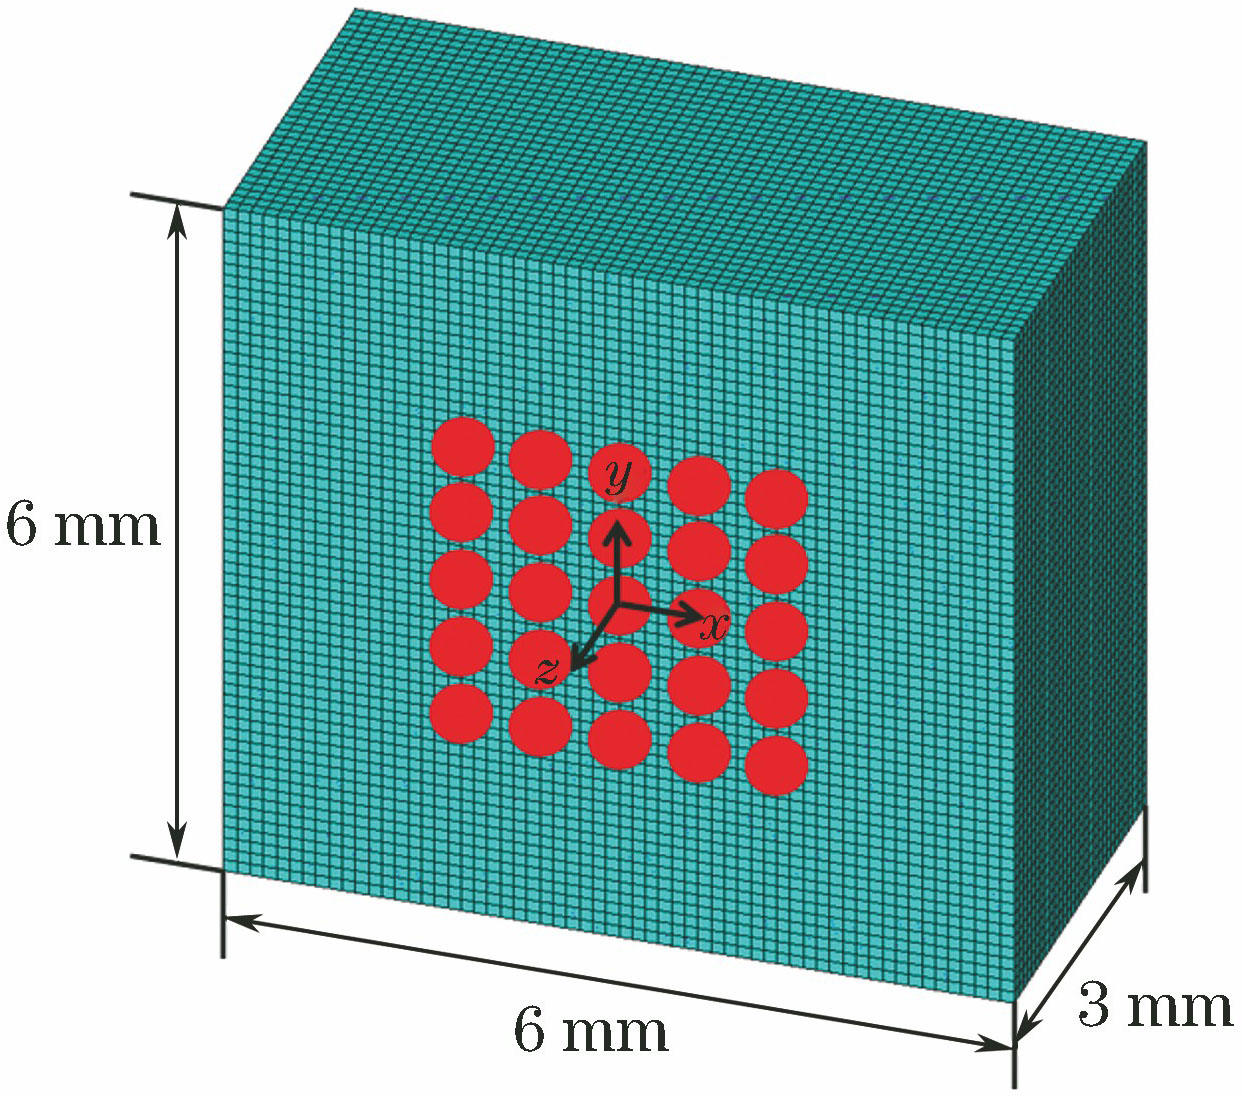
    Fig. 2. Finite element model on account of numerical simulation of temperature field during laser transformation hardening based on beam discretization
    Temperature-field distributions. (a) Overall temperature distribution; (b) xz cross-section temperature distribution
    Fig. 3. Temperature-field distributions. (a) Overall temperature distribution; (b) xz cross-section temperature distribution
    Temperature variation of each point with time
    Fig. 4. Temperature variation of each point with time
    Temperature distributions on different paths at different laser powers. (a) Path A; (b) path B
    Fig. 5. Temperature distributions on different paths at different laser powers. (a) Path A; (b) path B
    Morphologies of hardened layer with different laser powers[22]. (a) P=4500 W; (b) P=5000 W; (c) P=5500 W; (d) P=6000 W
    Fig. 6. Morphologies of hardened layer with different laser powers[22]. (a) P=4500 W; (b) P=5000 W; (c) P=5500 W; (d) P=6000 W
    Temperature distributions on different paths at different laser loading time. (a) Path A; (b) path B
    Fig. 7. Temperature distributions on different paths at different laser loading time. (a) Path A; (b) path B
    Morphologies of hardened layer with different laser loading time. (a) t=0.1 s; (b) t=0.2 s; (c) t=0.3 s; (d) t=0.4 s
    Fig. 8. Morphologies of hardened layer with different laser loading time. (a) t=0.1 s; (b) t=0.2 s; (c) t=0.3 s; (d) t=0.4 s
    Maximum depths of hardened layer obtained under different conditions. (a) Different laser powers; (b) different laser loading time
    Fig. 9. Maximum depths of hardened layer obtained under different conditions. (a) Different laser powers; (b) different laser loading time
    Temperature /℃Heat conductivitycoefficient /(W·m-1·K-1)Specific heatcapacity /(J·kg-1·K-1)Density /(kg·m-3)
    2542.374657086
    20043.345557086
    40041.036457086
    60038.027877086
    80037.298717086
    100035.699787086
    120034.899387086
    Table 1. Thermophysical parameters of vermicular graphite cast iron[22]
    Ming Pang, Wendan Tan. Numerical Simulation of Temperature Field During Laser Transformation Hardening Vermicular Graphite Cast Iron Based on Beam Discretization[J]. Laser & Optoelectronics Progress, 2019, 56(19): 191404
    Download Citation