
Zichao Zhang, Zonghua Zhang, Nan Gao, Zhaozong Meng. U-Net-based Structured Light Three-dimensional Measurement Technology[J]. Laser & Optoelectronics Progress, 2021, 58(20): 2010003
- Laser & Optoelectronics Progress
- Vol. 58, Issue 20, 2010003 (2021)
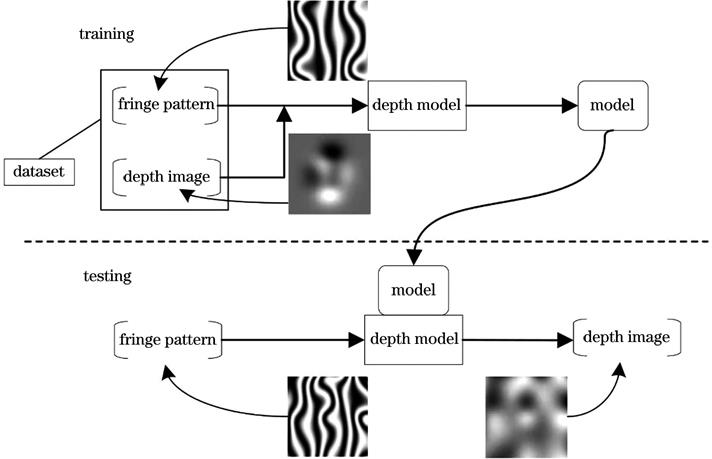
Fig. 1. Procedure of neural network 3D measurement
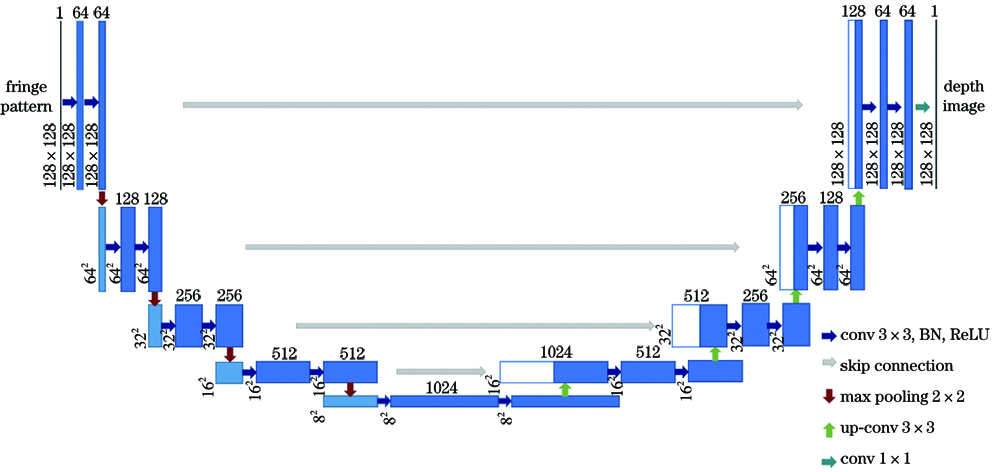
Fig. 2. Convolutional neural network structure
Fig. 3. Part data in the dataset
Fig. 4. Loss curves of the training set and validation set. (a) Loss curve of the training set; (b) loss curve of the validation set
Fig. 5. Experiment results of simulation. (a)(f)(k) Depth images; (b)(g)(l) depth images predicted by proposed method; (c)(h)(m) error images of proposed method; (d)(i)(n) depth images predicted by method in Ref.[20]; (e)(j)(o) error images of method in Ref.[20]
Fig. 6. 3D effect. (a)(d)(g) 3D shape images; (b)(e)(h) predicted 3D shape images; (c)(f)(i) error images
Fig. 7. Photograph of 3D measurement system
Fig. 8. Deformed fringe patterns obtained by camera. (a) Deformed fringe pattern of mask; (b) deformed fringe pattern of human hand
Fig. 9. 3D shape data of real objects. (a) 3D shape data of mask; (b) 3D shape data of human hand; (c) detail display of mask eye; (d) detail display of human hand finger
Fig. 10. Generalization capability analysis results. (a)(f) Depth images; (b)(g) depth images predicted by proposed method; (c)(h) error images of proposed method; (d)(i) depth images predicted by method in Ref.[20]; (e)(j) error images of method in Ref.[20]
Fig. 11. 3D effect. (a)--(c) 3D shape data, predicted 3D shape data, and error image of sample 1; (d)--(f) 3D shape data, predicted 3D shape data, and error image of sample 2
Fig. 12. Anti-noise capability analysis results. (a)(e)(i)(m) Deformed fringe images; (b)(f)(j)(n) depth images; (c)(g)(k)(o) predicted depth images; (d)(h)(l)(p) error images
Fig. 13. 3D effect. (a)(d)(g)(i) 3D shape data; (b)(e)(h)(k) predicted 3D shape data; (c)(f)(i)(l) error images
|
Table 1. Error analysis of simulation experiment
|
Table 2. Error analysis of real objects
|
Table 3. Error analysis of 3D object sample
|
Table 4. Noise analysis of validation set and test set

Set citation alerts for the article
Please enter your email address
© Copyright 2018-2021 | Chinese Laser Press. All Rights Reserved 沪ICP备15018463号-20