
Jue Wang, Xiuying Zhang, Yufang Cai, Yanping Lu. CT Image Segmentation Method Combining Wavelet Transform and RSF Model[J]. Acta Optica Sinica, 2020, 40(21): 2110003
- Acta Optica Sinica
- Vol. 40, Issue 21, 2110003 (2020)
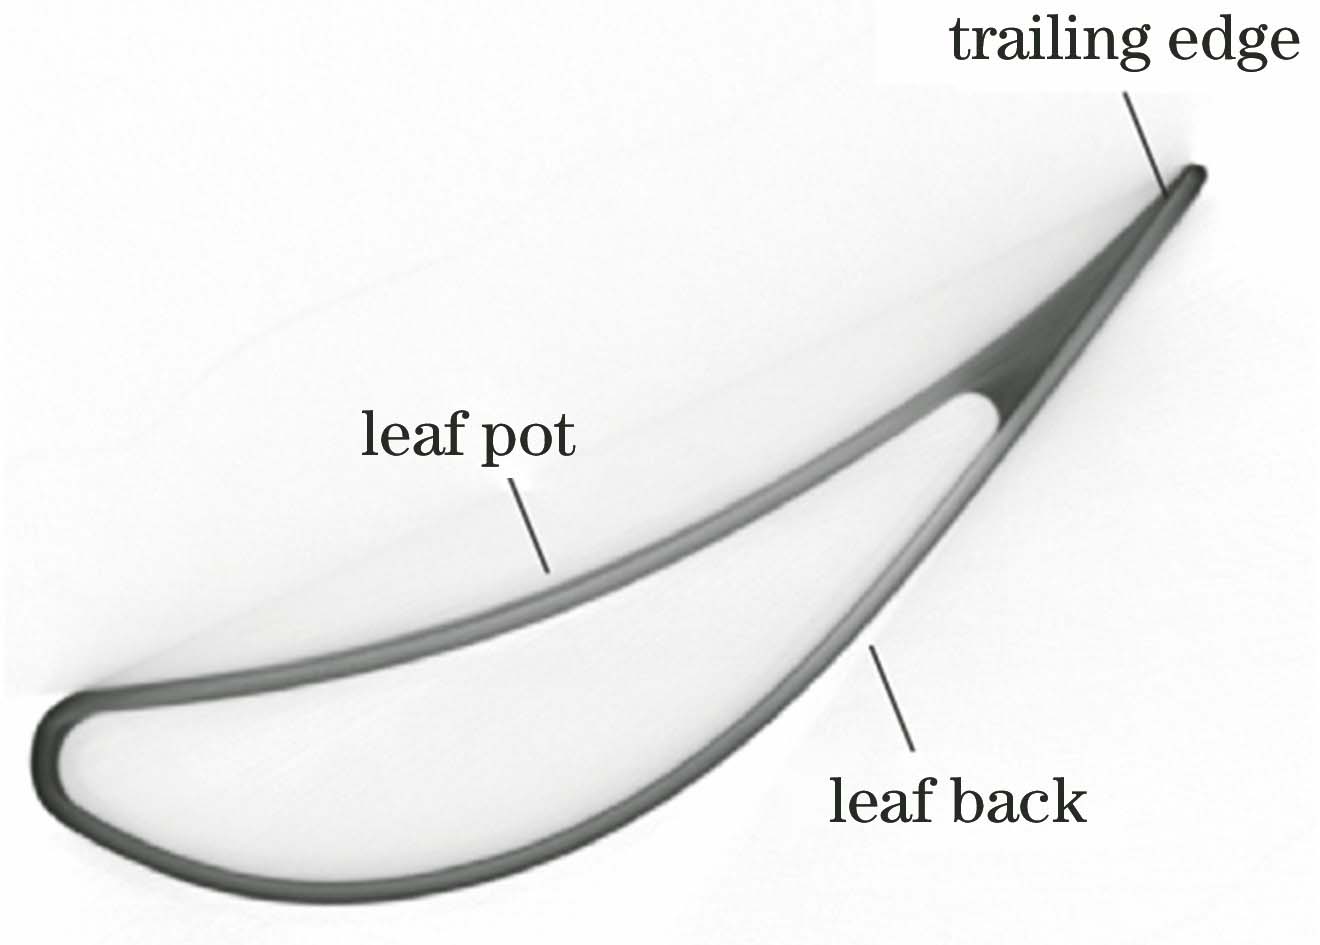
Fig. 1. Diagram of blade structure
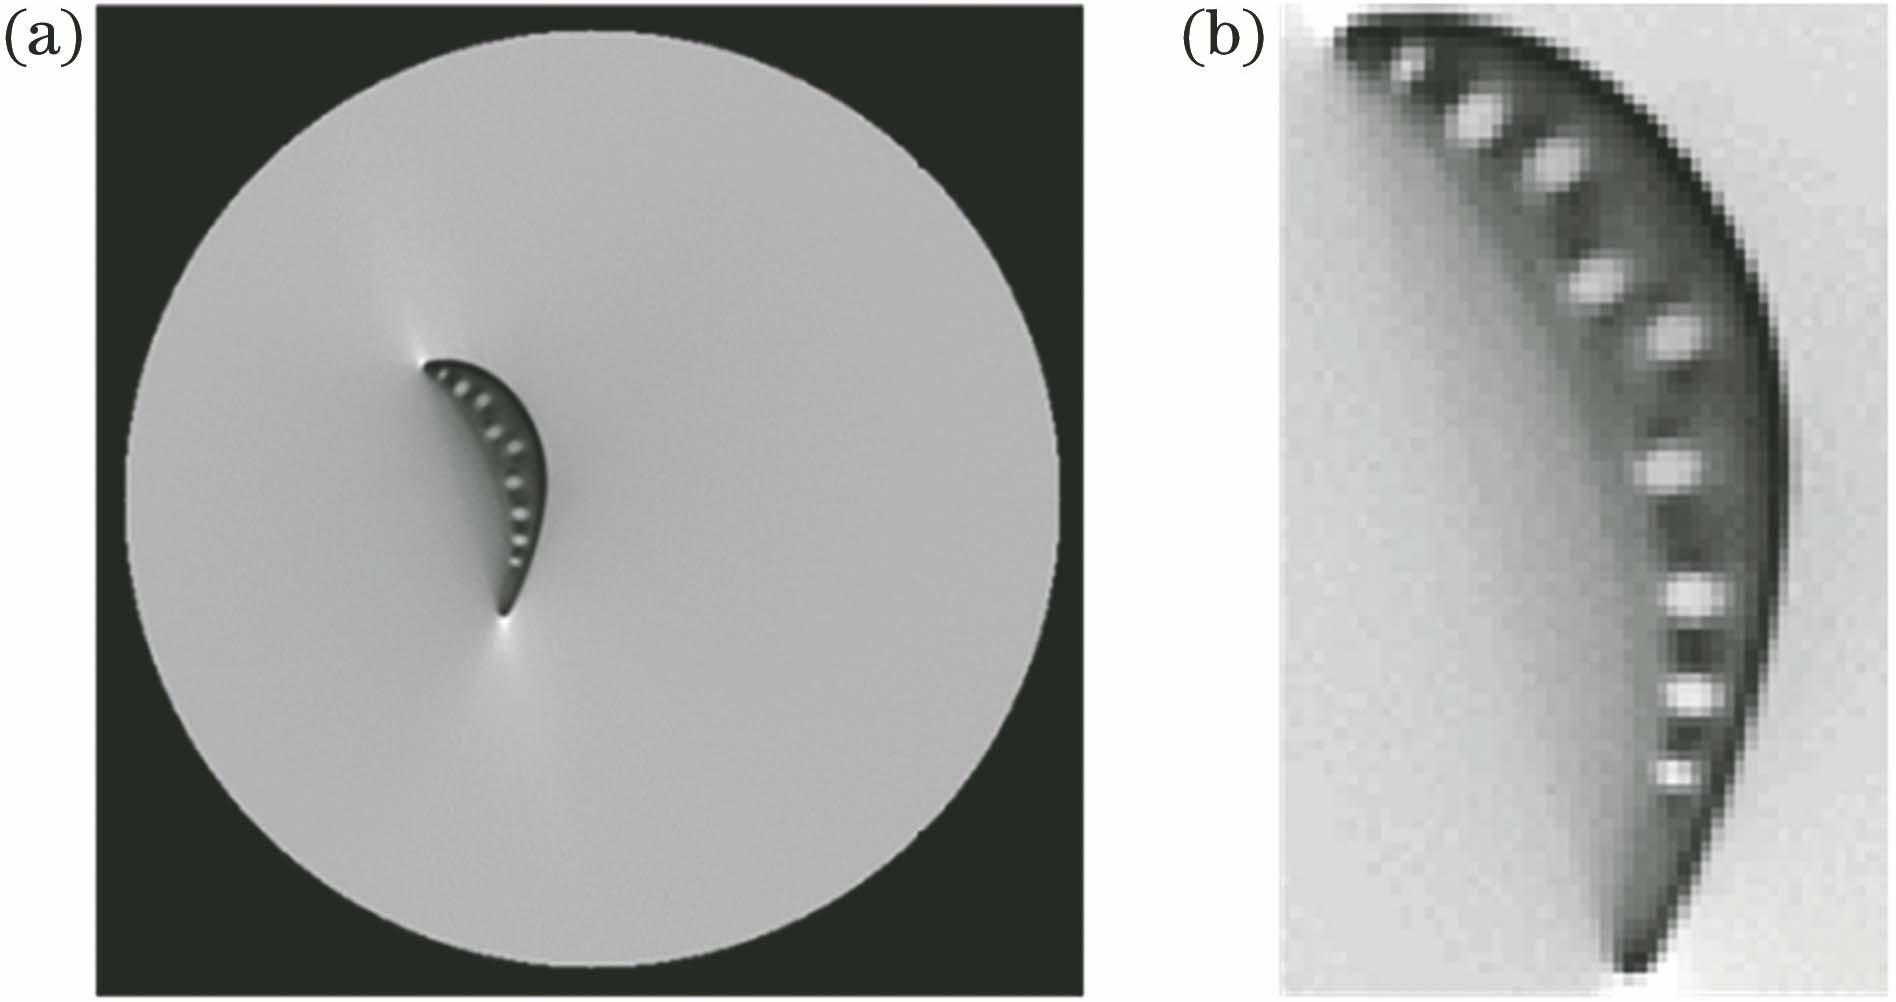
Fig. 2. Weak edge of CT image. (a) CT image of blade; (b) region of interest
Fig. 3. Flow chart of CT image measurement
Fig. 4. CT images. (a) Sample 1; (b) sample 2; (c) sample 3
Fig. 5. Comparison before and after wavelet transform. (a) Sample 1; (b) sample 2; (c) sample 3
Fig. 6. Grayscale comparison. (a) Sample 1; (b) sample 2; (c) sample 3
Fig. 7. Comparison of segmentation results
Fig. 8. Comparison of CV and RSF segmentation effects. (a)-(c) Segmentation results of CV and its local enlargement; (d)-(f) segmentation results of RSF and its local enlargement
Fig. 9. Segmentation results of RSF and CV combined wavelet transform on multi-cavity blade. (a) WT+CV; (b) WT+RSF
Fig. 10. CT image segmentation results of standard gauge blocks. (a) Original image; (b) CV; (c) WT+RSF
|
Table 1. Parameters of experiment
|
Table 2. Local average gradient of image
|
Table 3. Experimental parameter setting
| ||||||||||||||||||||||||||||||||||||||||||||||||||||||||||||||||||||||||||||||||||||||
Table 4. Test results of standard gauge blocks

Set citation alerts for the article
Please enter your email address
© Copyright 2018-2021 | Chinese Laser Press. All Rights Reserved 沪ICP备15018463号-20