• Geographical Research
  • Vol. 39, Issue 10, 2268 (2020)
Liangjian WANG, Zhen LIU*, Wei ZHANG, Han LI, and Yan LIU
Author Affiliations
  • College of Economics Trade, Human University, Changsha 410079, China
  • show less
    DOI: 10.11821/dlyj020191097 Cite this Article
    Liangjian WANG, Zhen LIU, Wei ZHANG, Han LI, Yan LIU. The influence of the policy adjustment on the increase of grain production and farmers' income in restricted development zones[J]. Geographical Research, 2020, 39(10): 2268 Copy Citation Text show less
    Scope of the study area
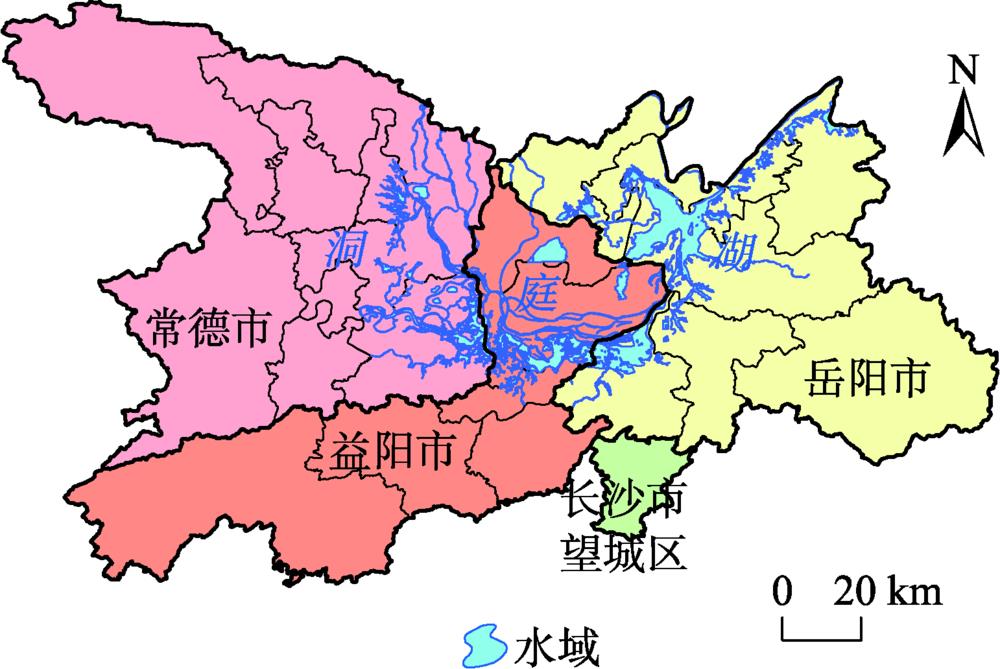
    Fig. 1. Scope of the study area
    变量含义计算方法与来源观察值平均数方差最小值最大值
    人均粮食产量(Y1粮食总产量/农村人口9570.82680.30610.29791.6653
    农民人均收入(Y2湖南省统计年鉴95776.347749.42169.0522294.0573
    人均播种面积(X1粮食播种面积/农村人口9571.45190.73920.386019.1259
    人均农机动力拥有量(X2农机总动力/农村人口9571.43380.75510.25157.6279
    有效灌溉面积占比(X3有效灌溉面积/总面积95714.85459.17551.913353.2258
    农民人均第一产业增加值(X4第一产业增加值/农村人口95766.880635.931213.0000222.8758
    城镇化率(X5城镇人口/总人口9570.37820.10470.17130.7706
    人均社会固定资产投资(X6社会固定资产投资/总人口957166.6415168.71375.32911177.1300
    第一产业增加值占比(X7第一产业增加值/地区总产值9570.21520.08500.03440.5064
    人均第二产业增加值(X8第二产业增加值/地区总人口95799.7436112.58025.7810832.0853
    人均第三产业增加值(X9第三产业增加值/地区总人口95774.612249.624512.2654378.4332
    Table 1. Descriptive statistics of variables
    变量Y1(未加入控制变量)Y1(加入控制变量)Y2(未加入控制变量)Y2(加入控制变量)
    du×dt0.0278*(0.067)0.0382***(0.004)0.0904(0.153)0.1020*(0.099)
    X10.1558**(0.048)
    X20.0444**(0.011)
    X30.0009(0.955)
    X40.2545***(0.000)
    X51.5598**(0.014)
    X60.0859(0.115)
    X71.6722*(0.056)
    X80.2162**(0.020)
    X90.2272**(0.015)
    个体固定效应(φi)控制控制控制控制
    时间固定效应(ηt)控制控制控制控制
    R-squared0.70000.80160.81100.8331
    Table 2. Regression results of models
    交互项Y1Y2
    政策前6年0.0147(0.410)0.0273(0.151)
    政策前5年0.0281(0.207)-0.235(0.503)
    政策前4年0.0183(0.433)0.0210(0.563)
    政策前3年0.0209(0.390)0.0859(0.227)
    政策前2年0.0416(0.101)0.1254*(0.074)
    政策前1年0.0548**(0.037)0.1159(0.113)
    政策实施年0.0615**(0.019)0.1380*(0.093)
    政策后1年0.0714**(0.011)0.1496*(0.097)
    政策后2年0.0565*(0.053)0.1664*(0.084)
    政策后3年0.0682**(0.036)0.1736(0.102)
    Table 3. Parallel assumptions about the temporal variation trend of increasing production and increasing income of farmers
    变量变量替换Y1反事实检验Y1反事实检验Y2
    du×dt0.0382***(0.004)0.0089(0.414)-0.0215(0.679)
    X1-0.8442***(0.000)0.1608**(0.046)
    X20.0444**(0.011)0.0411**(0.012)
    X30.0009(0.955)-0.0011(0.948)
    X40.2545***(0.000)0.2420***(0.000)
    X51.5317**(0.019)
    X60.0821(0.143)
    X71.4526*(0.087)
    X80.2197**(0.020)
    X90.2227**(0.024)
    个体固定效应(φi)控制控制控制
    时间固定效应(ηt)控制控制控制
    R-squared0.83930.79740.8303
    Table 4. Robustness test
    变量Y1变量Y2
    du×dt0.0376***(0.006)0.0175(0.515)du×dt0.0787*(0.098)0.0446(0.770)
    X10.2939***(0.001)0.0595(0.157)X51.3814**(0.028)2.2966*(0.053)
    X20.0644***(0.002)0.0244(0.237)X60.0511(0.383)0.2320***(0.004)
    X30.0036(0.833)0.0092(0.795)X70.1178(0.867)5.8650***(0.002)
    X40.2154***(0.000)0.2920***(0.000)X80.0974(0.211)0.6679**(0.033)
    X90.1871*(0.069)0.0799(0.757)
    个体固定效应(φi)控制控制个体固定效应(φi)控制控制
    时间固定效应(ηt)控制控制时间固定效应(ηt)控制控制
    R-squared0.83320.7895R-squared0.85030.8949
    Table 5. Effect of implementation in counties and cities
    变量水稻玉米大豆
    du×dt0.0537***(0.000)0.0358(0.731)-0.0016(0.984)
    X10.1405*(0.055)0.2783**(0.034)0.3073*(0.094)
    X20.0351*(0.089)0.1818(0.140)0.0458(0.675)
    X3-0.0019(0.929)-0.0675(0.570)-0.0093(0.906)
    X40.2876***(0.000)-0.4325(0.127)0.5551**(0.012)
    个体固定效应(φi)控制控制控制
    时间固定效应(ηt)控制控制控制
    R-squared0.71730.50720.2315
    Table 6. Effects of different grain yield increases
    Liangjian WANG, Zhen LIU, Wei ZHANG, Han LI, Yan LIU. The influence of the policy adjustment on the increase of grain production and farmers' income in restricted development zones[J]. Geographical Research, 2020, 39(10): 2268
    Download Citation