• Chinese Optics Letters
  • Vol. 19, Issue 7, 071702 (2021)
Yujiao Shi1、2、* and Zhenhui Zhang1、2
Author Affiliations
  • 1MOE Key Laboratory of Laser Life Science & Institute of Laser Life Science, College of Biophotonics, South China Normal University, Guangzhou 510631, China
  • 2Guangdong Provincial Key Laboratory of Laser Life Science, College of Biophotonics, South China Normal University, Guangzhou 510631, China
  • show less
    DOI: 10.3788/COL202119.071702 Cite this Article Set citation alerts
    Yujiao Shi, Zhenhui Zhang. Nonlinear photoacoustic imaging dedicated to thermal-nonlinearity characterization[J]. Chinese Optics Letters, 2021, 19(7): 071702 Copy Citation Text show less
    (a) Spatial distribution of thermal diffusion speed along the radial position of a Gaussian energy distributed laser spot under linear and nonlinear thermal diffusion regimes. (b) Process diagram of PA harmonic generation based on nonlinear thermal diffusion. (c) The fundamental frequency PA (FFPA) amplitudes, the second harmonic PA (SHPA) amplitudes, and PA nonlinear parameters (PANPs) as functions of the absorbed light energy; the inset is the relation between PANP and temperature coefficient of thermal diffusivity. (d) Schematic of the nonlinear PA imaging system. OB, objective; UT, ultrasonic transducer; Amp, amplifier.
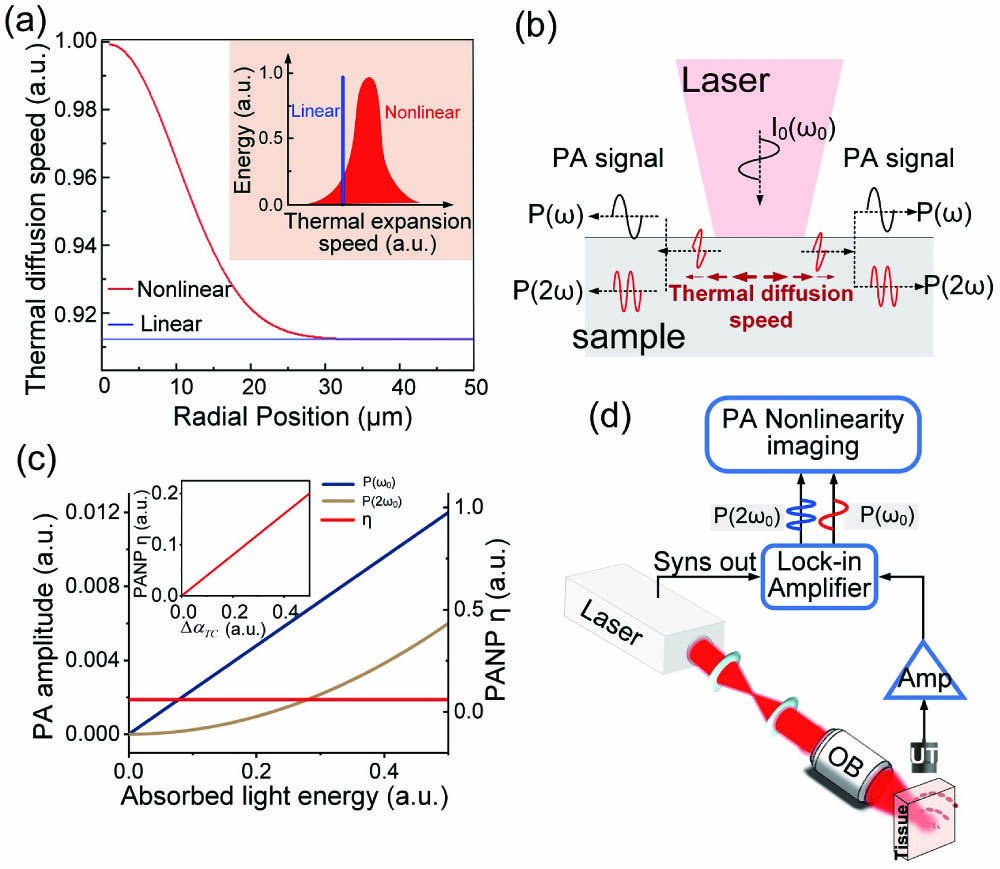
    Fig. 1. (a) Spatial distribution of thermal diffusion speed along the radial position of a Gaussian energy distributed laser spot under linear and nonlinear thermal diffusion regimes. (b) Process diagram of PA harmonic generation based on nonlinear thermal diffusion. (c) The fundamental frequency PA (FFPA) amplitudes, the second harmonic PA (SHPA) amplitudes, and PA nonlinear parameters (PANPs) as functions of the absorbed light energy; the inset is the relation between PANP and temperature coefficient of thermal diffusivity. (d) Schematic of the nonlinear PA imaging system. OB, objective; UT, ultrasonic transducer; Amp, amplifier.
    (a) FFPA, SHPA, and PANP imaging of agar phantoms with different optical absorption. The concentration of all agar phantoms is kept constant. (b) Schematic diagram of experimental sample. (c) Intensity of the FFPA, SHPA, and PANP signal amplitude profiles along the red dashed line in (a).
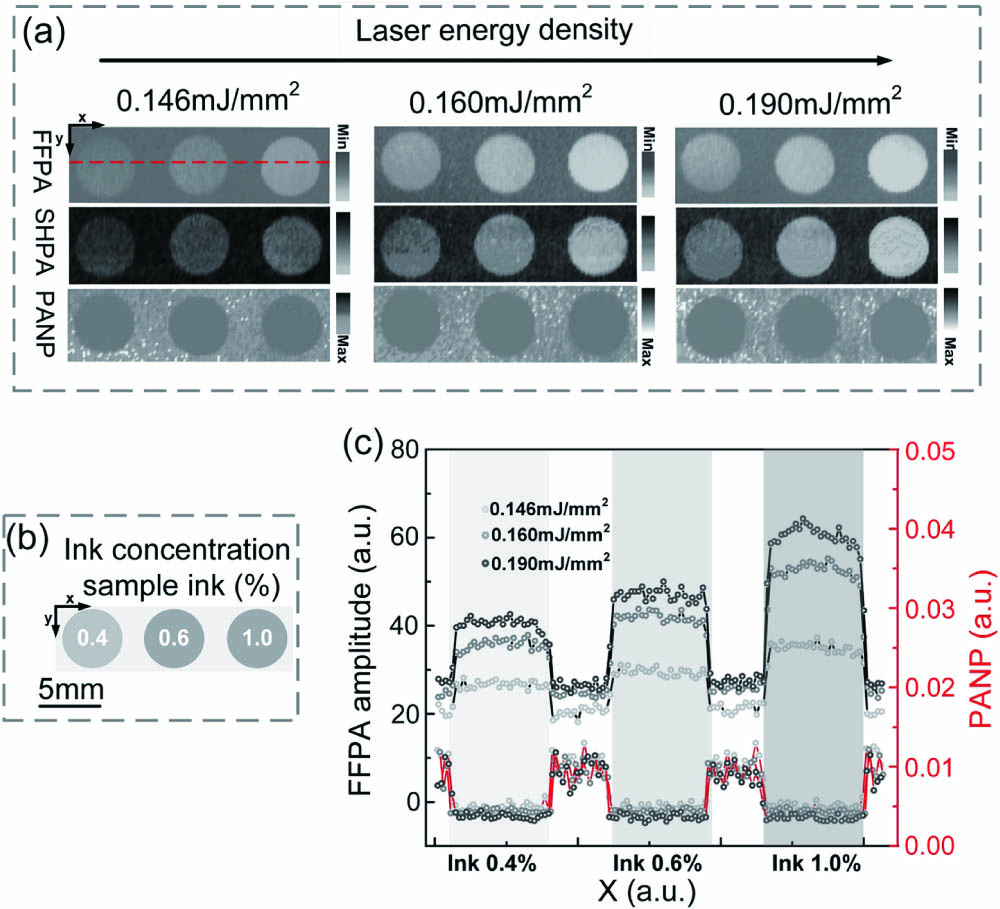
    Fig. 2. (a) FFPA, SHPA, and PANP imaging of agar phantoms with different optical absorption. The concentration of all agar phantoms is kept constant. (b) Schematic diagram of experimental sample. (c) Intensity of the FFPA, SHPA, and PANP signal amplitude profiles along the red dashed line in (a).
    (a) Photo of sample 1 that is composed of agar and polystyrene (PS) foam. (b), (c), and (d) are the FFPA image, the SHPA image, and the PANP image, respectively. (e) Photo of sample 2 that is composed of three agar phantoms with different concentrations of collagen and ink. (f), (g), and (h) are the FFPA, the SHPA, and the PANP images, respectively. (i) FFPA amplitudes and PANP profiles along the dashed lines in (b) and (d). (j) FFPA amplitudes and PANPs for agar phantoms of sample 2.
    Fig. 3. (a) Photo of sample 1 that is composed of agar and polystyrene (PS) foam. (b), (c), and (d) are the FFPA image, the SHPA image, and the PANP image, respectively. (e) Photo of sample 2 that is composed of three agar phantoms with different concentrations of collagen and ink. (f), (g), and (h) are the FFPA, the SHPA, and the PANP images, respectively. (i) FFPA amplitudes and PANP profiles along the dashed lines in (b) and (d). (j) FFPA amplitudes and PANPs for agar phantoms of sample 2.
    (a) Photograph of the sample; the dashed frame is the scanning area. (b) FFPA image. (c) SHPA image. (d) PANP image of the sample. (e) Photograph of different biological tissues of mice, marked as 1 spleen, 2 heart, 3 muscle, 4 fat, 5 lungs, 6 kidneys, and 7 liver. (f), (g), and (h) are the corresponding FFPA image, the SHPA image, and the PANP image, respectively. (i) Data statistics of FFPA signal amplitudes and PANP of the seven kinds of biological tissues.
    Fig. 4. (a) Photograph of the sample; the dashed frame is the scanning area. (b) FFPA image. (c) SHPA image. (d) PANP image of the sample. (e) Photograph of different biological tissues of mice, marked as 1 spleen, 2 heart, 3 muscle, 4 fat, 5 lungs, 6 kidneys, and 7 liver. (f), (g), and (h) are the corresponding FFPA image, the SHPA image, and the PANP image, respectively. (i) Data statistics of FFPA signal amplitudes and PANP of the seven kinds of biological tissues.
    Yujiao Shi, Zhenhui Zhang. Nonlinear photoacoustic imaging dedicated to thermal-nonlinearity characterization[J]. Chinese Optics Letters, 2021, 19(7): 071702
    Download Citation