1MOE Key Laboratory of Laser Life Science & Institute of Laser Life Science, College of Biophotonics, South China Normal University, Guangzhou 510631, China
2Guangdong Provincial Key Laboratory of Laser Life Science, College of Biophotonics, South China Normal University, Guangzhou 510631, China
We proposed a nonlinear photoacoustic (PA) technique as a new imaging contrast mechanism for tissue thermal-nonlinearity characterization. When a sine-modulated Gaussian temperature field is introduced by a laser beam, in view of the temperature dependence of the thermal diffusivity, the nonlinear PA effect occurs, which leads to the production of second-harmonic PA (SHPA) signals. By extracting the fundamental frequency PA and SHPA signal amplitudes of samples through the lock-in technique, a parameter that only reflects nonlinear thermal-diffusivity characteristics of the sample then can be obtained. The feasibility of the technique for thermal-nonlinearity characterization has been studied on phantom samples. In vitro biological tissues have been studied by this method to demonstrate its medical imaging capability, prefiguring great potential of this new method in medical imaging applications.
Photoacoustic (PA) imaging is a novel technology combining optical imaging and ultrasonic imaging that provides opportunities for noninvasively monitoring disease pathophysiology in vivo[1–5]. Owing to the capacity for high-resolution sensing optical contrast at depths beyond the optical transport mean-free paths, it overcomes the high scattering of optical photons in biological tissues, thus possessing multiscale imaging capabilities of living biological structures ranging in size from organelles to organs[6–11]. In conventional PA applications, usually nano/microsecond pulsed lasers are used as excitation sources to illuminate biological tissues[12,13]. The absorption of photons by the biomolecules thermoelasticity induces ultrasonic waves, and then the produced time-domain PA signals are detected by transducers[14]. By extracting the amplitudes of the PA signals, PA images that reflect the optical absorption of tissues can be reconstructed. Nevertheless, benefiting from the essence of the PA signal as thermoelastic waves, except for the signal amplitude, its spectral components equally and inherently carry specific information of the excited source. By adopting proper methods of signal detection and analysis, the frequency PA technique has great potential to be developed into new contrast mechanisms for material inspection and biological imaging. In PA applications, when the temperature rise exceeds a certain threshold, the thermal physical parameters such as thermal expansion coefficient, thermal diffusivity, and heat capacity of the excited state samples change significantly[15–17], which makes a significant contribution to the nonlinear conversion from absorbed laser energy to PA waves. However, most of the reported nonlinear PA methods are based on the linear dependence of the PA signal amplitude on the temperature of the excited samples[9,18–22], which has been widely used in the application of fatty liver imaging and oxygen saturation measurement.
In our previous work[23], we have proposed a second-harmonic PA (SHPA) technique for the characterization of nonlinear thermal properties of the samples. As a sine-modulated Gaussian beam with modulation frequency is irradiated on samples, a Gaussian temperature field is produced. By considering the temperature dependence of the sample’s thermal diffusivity, a nonlinear frequency-domain PA effect occurs, and the SHPA signal is produced[23,24]. However, as the amplitudes of SHPA signals are from a strongly excited laser, nonlinear thermal imaging by extracting a new characteristic parameter and its applications depend on nonspecific parameters such as optical absorption, fluence, and modulation frequency of biomedical imaging, which has not yet been studied. In this work, by using the nonlinear PA effect in the frequency domain, we proposed a PA nonlinear parameter (PANP) as a new imaging contrast mechanism for material inspection and biomedical applications through thermal-nonlinearity characterization, which shows that PANP imaging can distinguish samples based on different thermal parameters, and that it is a good supplement to PA imaging. The proposed nonlinear PA technique expands the scope of conventional PA techniques, which cannot only be used as a new imaging method for disease detection, but also as a new detection method in material science for surface defect detection and microelectronic applications.
2. Methods
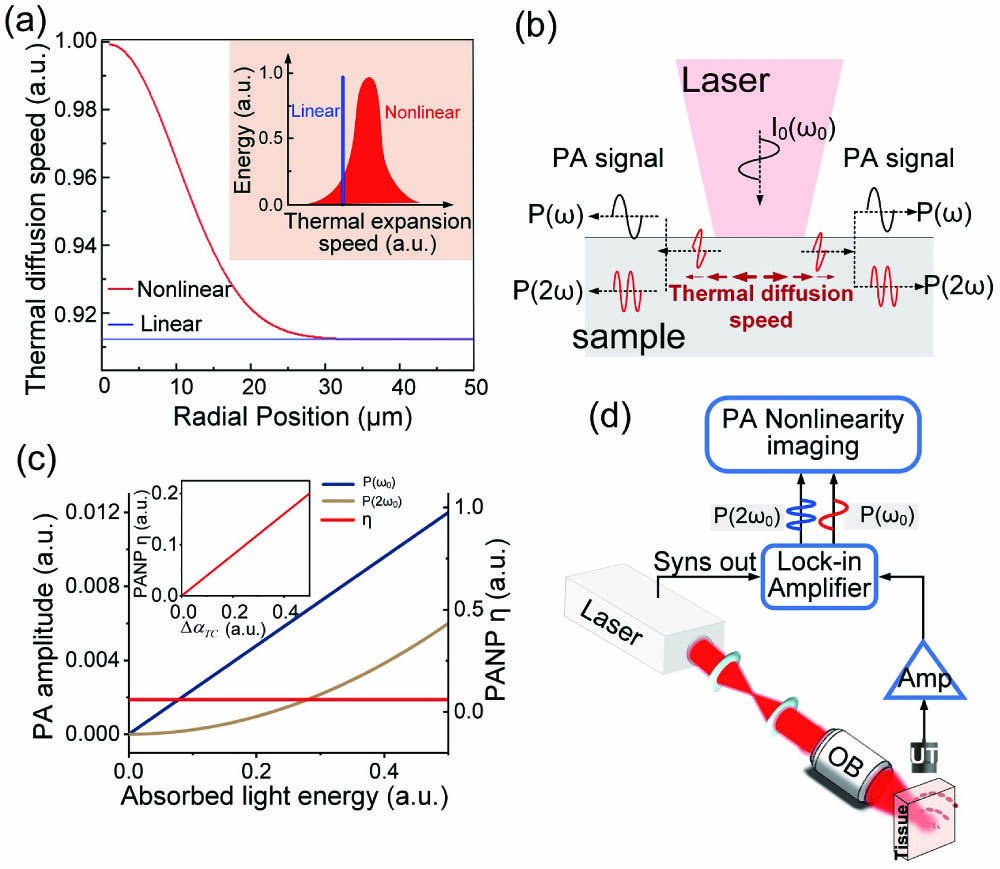
In the nonlinear regime, where the laser-induced temperature rise is neglectable, the thermal diffusivity of the sample cannot be considered as a constant, which is usually linearly related to the temperature as . Here, is the thermal diffusivity at room temperature, and is the temperature coefficient of thermal diffusivity. Assuming that a sine-modulated Gaussian laser beam with optical fluence is irradiated on the sample, the temperature field distribution satisfies the Gaussian distribution, where , and are the laser fluence, modulation frequency, Gaussian radius of the laser spot, and radial position, respectively. For the nonlinear thermal diffusion regime, as the thermal wave speed strongly depends on the thermal diffusivity , the Gaussian distribution of the temperature field induces a non-uniform thermal wave speed along the radial position, which thereafter induces a spatial thermal diffusion speed distribution along the radial position, as shown in simulation results in Fig. 1(a), which thus breeds a harmonic temperature field. The lower edge temperature leads to slower thermal diffusion, and thus thermal energy is restricted in the core area of the laser spot. For the linear thermal diffusion regime that considers the thermal-diffusivity constant, only the fundamental temperature field exists. Thus, the frequency of the produced PA signals is the same as the laser modulation frequency. Differently, for the nonlinear thermal diffusion regime that considers the thermal diffusivity as a linear function of the temperature, the broadening of the thermal diffusion speed due to the thermal nonlinear effect will induce thermal expansion speed broadening [inset of Fig. 1(a)], which thus will breed PA harmonic signals, as shown in Fig. 1(b). We consider that the relationship between sound pressure and temperature field can be simplified as [25], where is the isothermal compression coefficient, is the thermal expansion coefficient, and, for tissues, they can be considered as a constant. The fundamental frequency PA (FFPA) signal pressure and the SHPA signal pressure thus can be obtained, respectively, as[23]
Sign up for Chinese Optics Letters TOC. Get the latest issue of Chinese Optics Letters delivered right to you!Sign up now
Figure 1.(a) Spatial distribution of thermal diffusion speed along the radial position of a Gaussian energy distributed laser spot under linear and nonlinear thermal diffusion regimes. (b) Process diagram of PA harmonic generation based on nonlinear thermal diffusion. (c) The fundamental frequency PA (FFPA) amplitudes, the second harmonic PA (SHPA) amplitudes, and PA nonlinear parameters (PANPs) as functions of the absorbed light energy; the inset is the relation between PANP and temperature coefficient of thermal diffusivity. (d) Schematic of the nonlinear PA imaging system. OB, objective; UT, ultrasonic transducer; Amp, amplifier.
Here, is the thermal conductivity at room temperature, and is the optical absorption coefficient. It shows in Eq. (2) that, due to the nonlinear thermal diffusion effect, the SHPA signal is produced. The SHPA signal amplitude is proportional to the temperature coefficient of thermal diffusivity, which thus provides the possibility of extracting thermal nonlinearity by the SHPA imaging technique. When the nonlinear thermal diffusivity is neglected, the SHPA signal part disappears.
From Eqs. (1) and (2), we find that the FFPA signal amplitude is proportional to the optical fluence and the optical absorption, while the SHPA amplitude is proportional to the square of the optical fluence and the optical absorption. To obtain the thermal nonlinearity of the sample, the PANP related to the temperature coefficient of thermal diffusivity is obtained based on the ratio of the second-harmonic amplitude to the square of the fundamental frequency amplitude :
For biological tissues, we consider the thermal expansion coefficient to be constant. It shows in Eq. (3) that the PANP varies linearly with the temperature coefficient of thermal diffusivity. As the PANP is insensitive to the optical absorption, it, thus, can be considered as a new parameter to provide complementary information to conventional PA techniques. In addition, according to the theoretical analysis of Eqs. (1)–(3), the theoretically predicted lateral resolutions for the three parameters of FFPA, SHPA, and PANP can be obtained, where the PANP image has the best resolution.
In Fig. 1(c), the relationship among the values of the FFPA signal and SHPA signal, PANP, and the absorbed light energy is shown. In the inset of Fig. 1(c), the simulation result for PANP as a function of the temperature coefficient of thermal diffusivity is provided. It shows that the PANP changes linearly with , demonstrating that the PANP can be used to reflect the temperature coefficient of thermal diffusivity of an interest sample.
The schematic diagram of the nonlinear PA imaging system is shown in Fig. 1(d). In the experiments, a pulsed square wave laser (DS20HE-1064D/R, Photonics) with 1064 nm wavelength and 30 kHz repetition frequency was used as the excitation source, and the lock-in amplifier (OE2031, SYSU Scientific Instruments) is locked at 30 kHz for the fundamental frequency and 60 kHz for the second-harmonic frequency. In the experiment, the laser is focused on the sample by the objective lens (), and the PA signal is received by a custom-made broadband ultrasonic transducer (10–100 kHz). Then, the PA signal passed through a low-noise, low-pass preamplifier (SR552, Stanford Research Systems) and is captured by the lock-in amplifier with a reference signal of 30 kHz. In this way, we realize the simultaneous acquisition of FFPA and SHPA signal amplitudes. By point-to-point scanning, the PANP image of the sample then can be obtained according to Eq. (3). In experiments, in order to improve the PA conversion efficiency, we use a square wave as the excitation source, which can be seen as a sum of a series sine waves with the fundamental frequency similar to the laser repetition frequency. In order to extract the thermal-nonlinearity-induced SHPA signals, we implemented Fourier series analysis by expanding the time function of the square wave laser excitation into the frequency domain. The PANP is therefore obtained as .
3. Results
In order to demonstrate that the PANP is independent of the optical absorption of samples, 1.0% concentration agar phantoms with different ink concentrations [Fig. 2(b)] are experimented at different laser energy densities. From the experimental results [Figs. 2(a) and 2(c)], we can see that the FFPA and the SHPA signal amplitudes are positively correlated with the laser energy density or optical absorption (i.e., ink concentration). Differently, the PANPs for agar phantoms are not significantly changed with the increase of laser power density or optical absorption, indicating their independence from the optical absorption or laser energy density.
Figure 2.(a) FFPA, SHPA, and PANP imaging of agar phantoms with different optical absorption. The concentration of all agar phantoms is kept constant. (b) Schematic diagram of experimental sample. (c) Intensity of the FFPA, SHPA, and PANP signal amplitude profiles along the red dashed line in (a).
To demonstrate the ability of the proposed nonlinear PA technique for material inspection, the phantom sample [Fig. 3(a)] consisting of agar and polystyrene (PS) foam was imaged, where the temperature coefficient of thermal diffusion for PS is reported to be much larger than that of agar phantoms (the main component is water)[15,26]. As shown in Fig. 3(b), the size and shape of the PS foam sample cannot be recognized in the FFPA image due to the similar ink concentration of the PS foam and agar. As the SHPA signal contains the information of the absorption coefficient and nonlinear characteristics of the sample, the SHPA image of the sample in Fig. 3(c) shows the size and shape congruence of the sample photograph. The corresponding PANP image is shown in Fig. 3(d), where better image contrast compared to the FFPA image is observed. The FFPA and PANP signal amplitude profiles along the dashed lines in Figs. 3(b) and 3(d) are presented in Fig. 3(i). These results indicate that the proposed method can be developed as a new executable and effective technique for material inspection, especially in surface defect detection and microelectronic applications. Besides the material inspection, the nonlinear PA technique also has great potential in biomedical applications such as physiologically and pathologically related biological component detecting and imaging. Collagen is one of the most important components in the human body, where its thermal diffusivity is reported to be sensitive to temperature[27]. To demonstrate the biological component detecting and imaging capabilities of the proposed method, phantom samples composed of different concentrations of collagen (Holland & Barrett) and ink are prepared, as shown in Fig. 3(e). The ink and collagen concentrations for the three phantoms are 1% ink and 0% collagen, 0.5% ink and 20% collagen, and 0.5% ink and 33.3% collagen, respectively. Experimental results in Figs. 3(f)–3(h) show that collagen concentrations can be reflected by the PANP [Fig. 3(h)] image extracted by the SHPA technique, while the FFPA [Fig. 3(f)] image only reflects the optical absorption of the examined samples. Figure 3(j) statistically analyzed the FFPA [Fig. 3(f)] and PANP [Fig. 3(h)] data for these samples, where the FFPA amplitudes are strongly dependent on the absorption coefficient of samples similar to conventional PA imaging, while the PANP imaging highly depends on nonlinear thermal properties of the samples and is independent of the absorption coefficient. The results indicate that the proposed new imaging contrast mechanism has great potential in biological applications.
Figure 3.(a) Photo of sample 1 that is composed of agar and polystyrene (PS) foam. (b), (c), and (d) are the FFPA image, the SHPA image, and the PANP image, respectively. (e) Photo of sample 2 that is composed of three agar phantoms with different concentrations of collagen and ink. (f), (g), and (h) are the FFPA, the SHPA, and the PANP images, respectively. (i) FFPA amplitudes and PANP profiles along the dashed lines in (b) and (d). (j) FFPA amplitudes and PANPs for agar phantoms of sample 2.
In order to demonstrate the ability of the proposed method for bio-applications, different biological tissues were imaged, as shown in Fig. 4. The result in Fig. 4(d) indicates that the two kinds of tissues (liver and muscle) can be clearly distinguished by the PANP imaging. The capability of the nonlinear PA imaging for biological imaging applications is further demonstrated by in vitro experiments on different mouse organs. Figure 4(e) is a photograph of mouse organs, marked as 1 spleen, 2 heart, 3 muscle, 4 fat, 5 lungs, 6 kidneys, and 7 liver. Figures 4(f)–4(h) are the FFPA, SHPA, and PANP images corresponding to Fig. 4(e), respectively. Figure 4(i) shows the histogram of the FFPA amplitude and the PANP in different mouse tissues. The results demonstrated that the SHPA signals and PANPs can be used as a new imaging contrast for providing complementary information to conventional PA techniques, prefiguring great potential of this new method in medical imaging applications.
Figure 4.(a) Photograph of the sample; the dashed frame is the scanning area. (b) FFPA image. (c) SHPA image. (d) PANP image of the sample. (e) Photograph of different biological tissues of mice, marked as 1 spleen, 2 heart, 3 muscle, 4 fat, 5 lungs, 6 kidneys, and 7 liver. (f), (g), and (h) are the corresponding FFPA image, the SHPA image, and the PANP image, respectively. (i) Data statistics of FFPA signal amplitudes and PANP of the seven kinds of biological tissues.
As the nonlinear thermal effect commonly exists in heat–matter interactions, the combination of the nonlinear PA effect and frequency-domain PA technique provides a possibility for extracting thermal nonlinearity of the excited medium, enabling thermal-nonlinearity imaging of specific optical absorbers. Compared with the conventional PA imaging, it can provide new information of the excited samples, thus extending the scope of PA imaging in material inspection and biomedical applications. Furthermore, the proposed method possesses an advantage in high-resolution imaging that has significant potential to be developed as a super-resolution imaging technique, where by obtaining higher-order PA harmonic signals, the lateral resolution may be further improved. In the nonlinear PA imaging, the lock-in amplifier is used for signal detection that greatly improves the signal-to-noise ratio (SNR), which has also been proved to possess the advantage of being technically simpler and more economical[28,29]. Compared with the FFPA and SHPA imaging, PANP can provide new information independent of the absorption coefficient of the excited samples, thus extending the scope of PA imaging in material inspection and biomedical applications. Especially, in biological imaging, the absorber with strong absorption of blood, pigment, etc. in the corresponding excitation wave band will have greater background interference to FFPA and SHPA images. The absorption-independent PANP image can get rid of the strong optical absorption background and therefore obtain background-suppressed images of the targeted area with high contrast. The limitation of the imaging speed can be improved by reducing the integration time of the lock-in amplifier. Additionally, the results can be improved by upgrading the hardware system, such as using a hydrophone detector with bandwidth (megahertz, MHz) and lock-in amplifiers with higher-frequency bands. During the experiments, as the modulation frequency is several tens of kilohertz, the thermal diffusion length is very small for biological tissues; thus, only considering the sample surface temperature changes is reasonable.
In conclusion, by using the nonlinear PA effect in the frequency domain, we proposed a PANP as a new imaging contrast mechanism for material inspection and biomedical applications through thermal-nonlinearity characterization. Experiments on phantoms are carried out to validate the physical model, and we further demonstrated the imaging ability of this method by in vitro tissue experiments. In vitro biological tissues have been studied by this method to demonstrate their medical imaging capabilities, prefiguring great potential of this new method in medical imaging applications.